Excel FORECAST.ETS Function Examples – Excel & Google Sheets
Written by
Reviewed by
This tutorial demonstrates how to use the Excel FORECAST.EST Function in Excel.
FORECAST.EST Function Overview
The FORECAST.EST Function is used to do exponential smoothing forecasts based on a series of existing values.
To use the FORECAST.EST Excel Worksheet Function, select a cell and type:
![]()
(Notice how the formula inputs appear)
FORECAST function Syntax and inputs:
FORECAST.ETS (target_date, values, timeline, [seasonality], [data_completion], [aggregation])Target_date – the data point for which to forecast a value. It can be represented by a date/time or number.
Values – a range or array of historical data for which you want to predict future values.
Timeline – an array of dates/times or independent numeric data with a constant step between them.
Seasonality (optional) – a number representing the length of the seasonal pattern:
Data completion (optional) – accounts for missing points.
Aggregation (optional) – specifies how to aggregate multiple data values with the same time stamp.
What is FORECAST.ETS?
The FORECAST.ETS function in Excel is used to forecast data using an exponential smoothing algorithm.
Exponential smoothing is a method in statistics used for smoothing time series data by assigning exponentially decreasing weights to future values over time. This differs from a simple moving average where past observations are weighted equally. The predicted value is a continuation of the historical values in the target date range, which should be a continuous timeline with an equal interval between dates. It can be used to predict future sales, inventory requirements or general consumer trends.
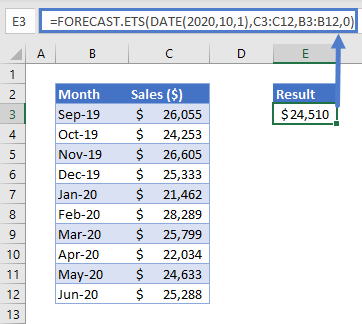
Suppose I have a table of sales data by month:
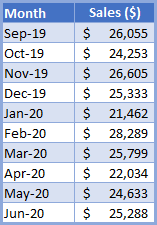
I want to know what the predicted sales amount will be for October 2020 based on the historical data shown in the table:
=FORECAST.ETS(DATE(2020,10,1),C3:C12,B3:B12)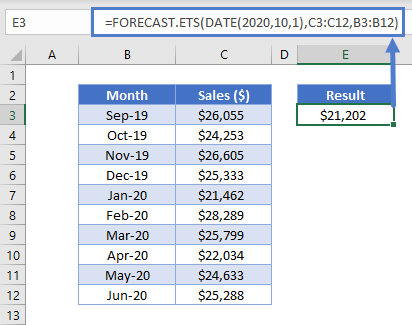
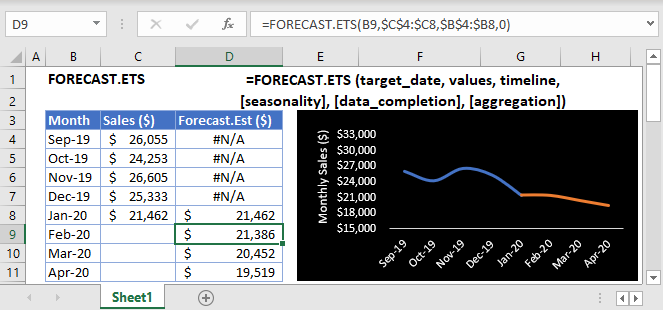
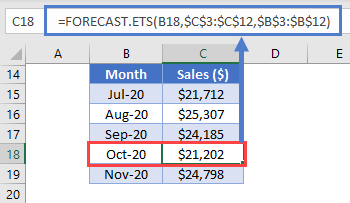
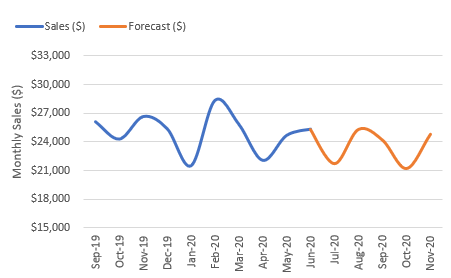
FORECAST.ETS returns a result of $21,202 in sales in October of 2020. We can visualize this and the predictions for months in-between by applying the formula to an expanded data table:
Visualizing the prediction:
How to use FORECAST.ETS
FORECAST.ETS has three required arguments and three optional arguments:
=FORECAST.ETS(target_date, values, timeline, [seasonality], [data_completion], [aggregation])Where target_date is the date you want to predict a value for, values is the array of historical data (sales in our case) and timeline is the array of a timeframe with an equal interval, such as daily, the 1st of the each month, the 1st of each year or even a continuous numerical index.
Seasonality is a positive integer representing the length of the seasonal pattern. The default is 1 meaning Excel detects seasonality automatically. Zero indicates no seasonality.
Data_completion: FORECAST.ETS supports up to 30% missing data and can adjust for those missing data points by using zero in their place or interpolating based on the neighboring datapoints.
Aggregation: FORECAST.ETS will aggregate values with the same timestamp, even though the timestamps require a constant step or interval. The argument uses a number representing an aggregation option with the default being zero, or average, and other options including SUM, COUNT, MIN, MAX, or MEDIAN.
Effect of Seasonality
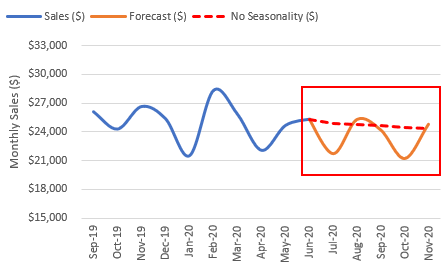
Using the example above, the October 2020 forecast value was $21,202 using the default value for seasonality. What if we did not apply seasonality?
Notice a zero was added as the last argument in the formula bar. The October predicted result is now $3,308 higher than the original prediction. Some data may not have any inherent seasonality, but in data that does have seasonality, it is a powerful option to ensure you have an accurate prediction. The below trend visualizes the same prediction, adding a forecast without seasonality for each forecasted month:
FORECAST.ETS Tips
- The target_date for the first argument must be chronologically after the date in the historical data array, timeline.
- If a constant step cannot be identified in the timeline, a #NUM! error will be returned.
- The max value for seasonality is 8,760 representing hours in a year. Any larger value will return a #NUM! error.
Interested in More Forecasting?
See our other articles on Forecasting with TREND, LINEST or FORECAST.LINEAR functions.

