Candlestick Chart in Excel
Written by
Reviewed by
This tutorial will demonstrate how to create a Candlestick Chart in Excel.
Candlestick Chart – Free Template Download
Download our free Candlestick Chart Template for Excel.
In this Article
What is a Candlestick Chart?
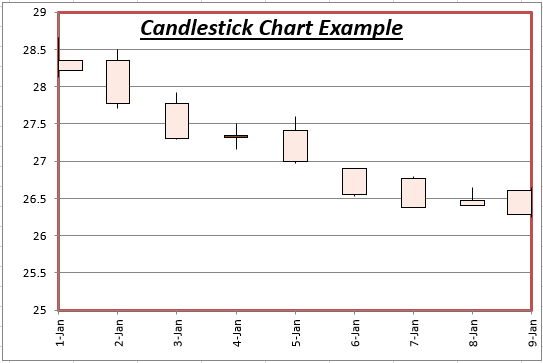
Candlestick charts display an asset price’s Open, High, Low, and Close prices over a period of time. They are sometimes referred to as the Japanese Candlestick chart. It’s name comes from its appearance: The graph looks like candles with a wick sticking out from both sides of the wax.
Layout of a Candlestick Chart
Each data point in the Candlestick chart will look like this:
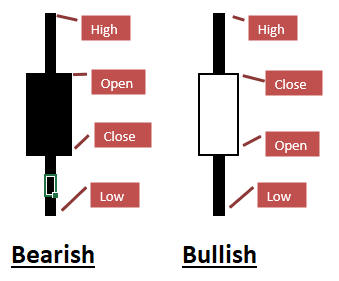
If the asset price closes higher than it opens (referred to as “Bullish”), the wax part of the candlestick will not be filled in. Alternatively, if the asset price closes at a lower price than it opens (Bearish), the wax will be a solid color.
You can see how the Candlestick graph can easily convey a lot of information. You can compare the High, Low, Open, and Close prices at a glance, allowing you to identify the daily volatility.
How to Create a Candlestick Chart
Below is a step-by-step guide to creating a candlestick graph.
Step #1: Data Preparation
First, you must organize your data in columns containing the Open, High, Low, and Close prices (in that order).
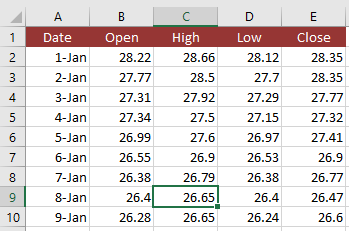
Optionally, you can also add a data label column to the front of the data. Usually this will be dates corresponding to the asset prices (as shown above).
Note: If the order does not match, your chart will not display properly and you will need to edit the Chart Data once the chart is created.
Step #2: Create the Chart
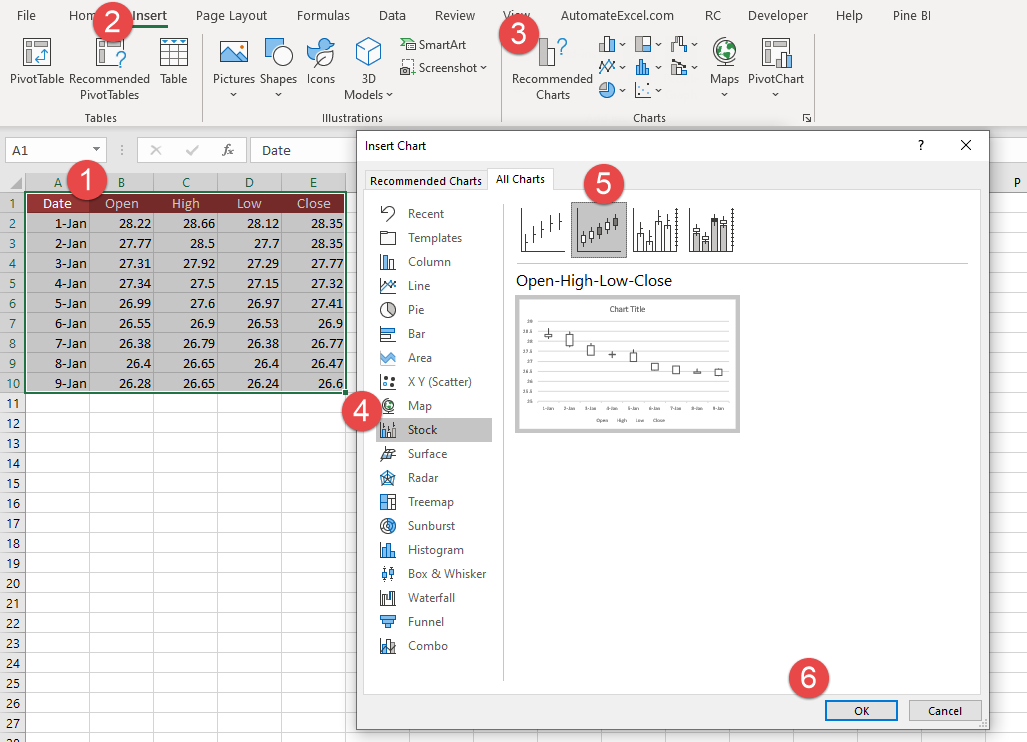
- Select your chart data
- Go to “Insert”
- Click the “Recommended Charts” icon
- Choose the “Stock” option
- Pick “Open-High-Low-Close” (See note below)
- Click “OK”
Now you should see a chart that looks like this:
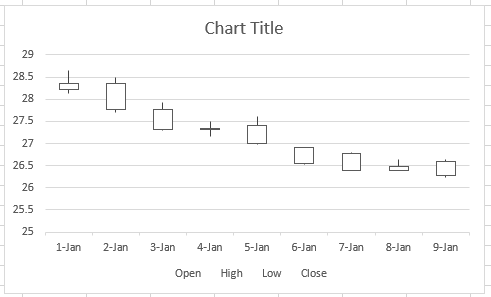
From here you can edit the chart to make it look however you’d like.
Download Candlestick Chart Template
Download our free Candlestick Chart Template for Excel.
