차트에서 격자선 제거 – Excel 및 Google 스프레드시트
Last updated on 7월 17, 2023
This tutorial will demonstrate how to remove gridlines on graphs in Excel and Google Sheets.
Remove Gridlines in Excel
Starting with your Graph
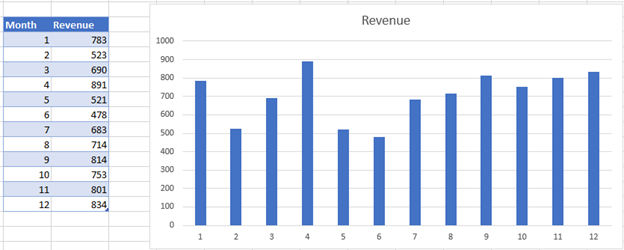
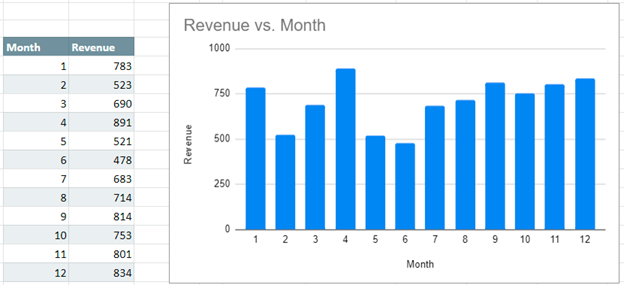
We’ll start with the below dataset. As you can see, the default for this graph shows horizontal gridlines.
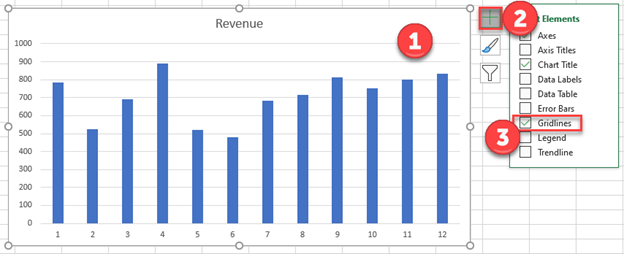
Removing Gridlines
- Click on Graph
- Select + Sign in top right of graph
- Uncheck Gridlines
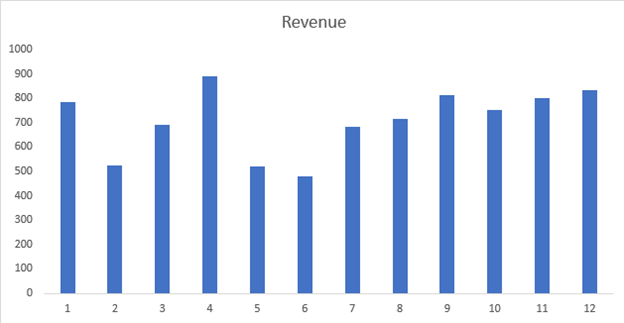
Final Graph without Gridlines
Your can see the final graph after removing the gridlines.
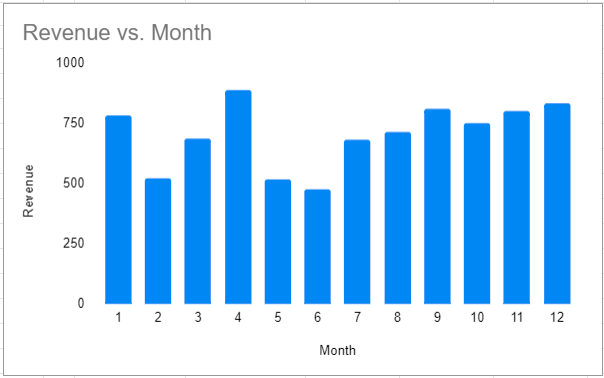
Remove Gridlines in Google Sheets
Starting with your Data
We’ll use the same data in Google Sheets as we did in Excel
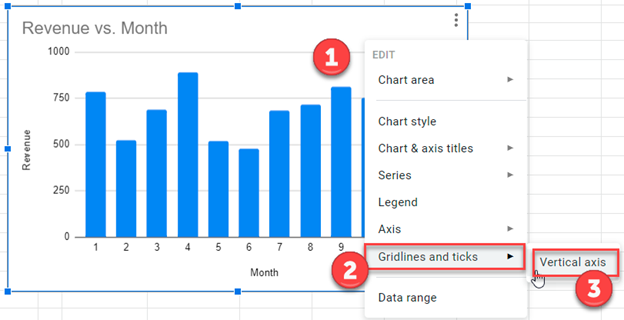
- Right click on the graph
- Select Gridlines and ticks
- Select Vertical Axis
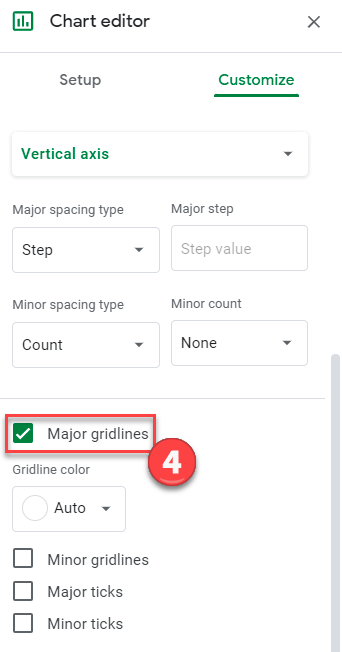
4. Uncheck Major Gridlines
Final Graph without Gridlines