vbaガイド:チャート・グラフ編
In this Article
Excelのチャートやグラフは、データを視覚的に表示するために使用します。このチュートリアルでは、VBAを使って チャートやチャートエレメントを作成、操作する方法について説明します。
ワークシートに埋め込まれたチャートや、独自のチャートシート上にチャートが作成出来るようになります。
VBAによる埋め込みチャートの作成
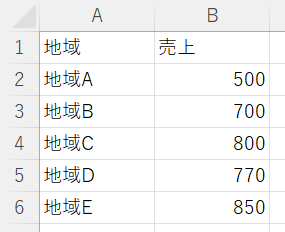
下図のように、ソースデータを含む範囲A1:B4があります。
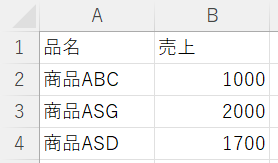
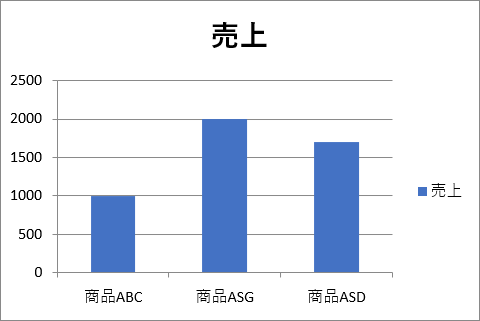
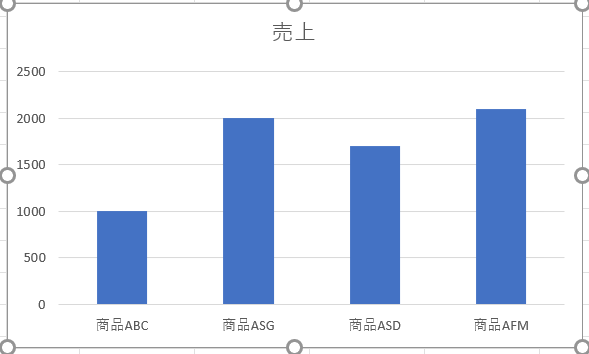
ChartObjects.Addメソッドでチャートを作成することができます。以下のコードでは、ワークシート上に埋め込みチャートを作成します。
Sub CreateEmbeddedChartUsingChartObject()

Dim embeddedchart As ChartObject

Set embeddedchart = Sheets("Sheet1").ChartObjects.Add(Left:=180, Width:=300, Top:=7, Height:=200)
embeddedchart.Chart.SetSourceData Source:=Sheets("Sheet1").Range("A1:B4")

End Sub
結果は以下のようになります。
Shapes.AddChartメソッドを使用してチャートを作成することもできます。次のコードは、ワークシート上に埋め込みチャートを作成します。
Sub CreateEmbeddedChartUsingShapesAddChart()

Dim embeddedchart As Shape

Set embeddedchart = Sheets("Sheet1").Shapes.AddChart
embeddedchart.Chart.SetSourceData Source:=Sheets("Sheet1").Range("A1:B4")

End Sub
VBAによるグラフの種類の指定
下図のように、ソースデータを含む範囲A1:B5を用意します。
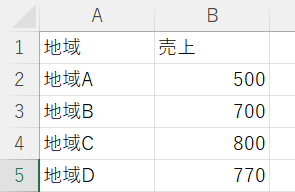
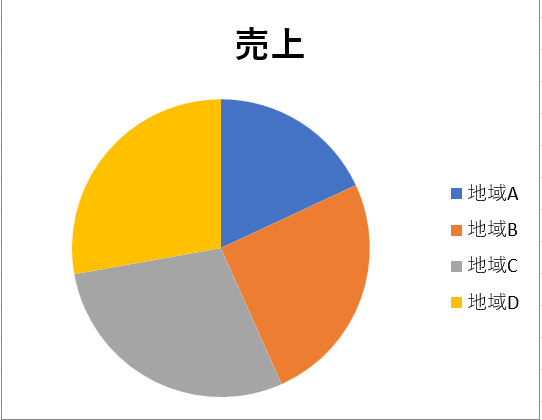
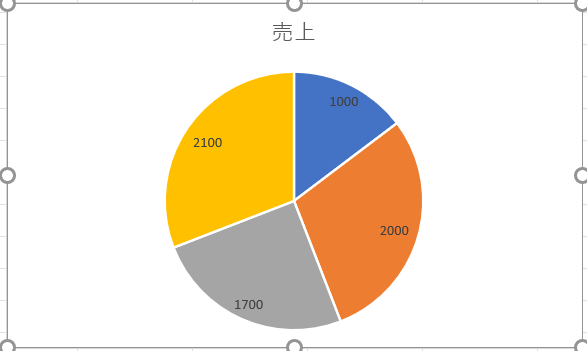
グラフの種類は、ChartTypeプロパティで指定できます。次のコードは、ChartTypeプロパティがxlPieに設定されているため、ワークシート上に円グラフを作成します。
Sub SpecifyAChartType()

Dim chrt As ChartObject

Set chrt = Sheets("Sheet1").ChartObjects.Add(Left:=180, Width:=270, Top:=7, Height:=210)
chrt.Chart.SetSourceData Source:=Sheets("Sheet1").Range("A1:B5")
chrt.Chart.ChartType = xlPie

End Sub
結果は以下のようにになります。
他にもありますが、通常指定される一般的なチャートの種類を紹介します。
- xlArea
- xlPie
- xlLine
- xlRadar
- xlXYScatter
- xlSurface
- xlBubble
- xlBarClustered
- xlColumnClustered
VBAによるグラフのタイトルの追加
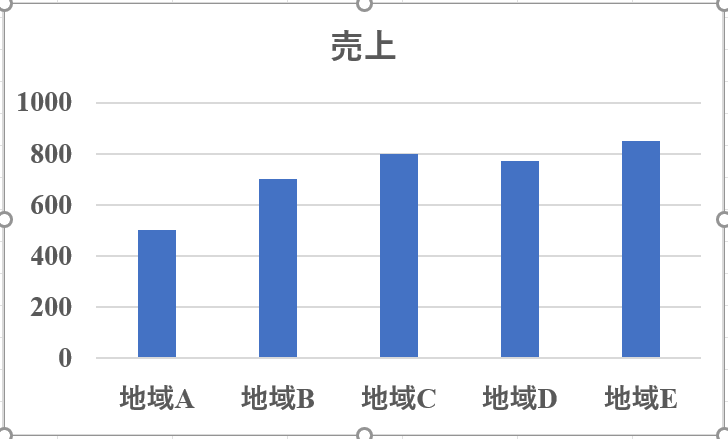
下図のように、ワークシートでチャートを選択しています。
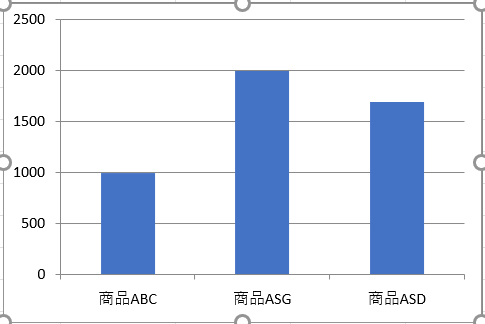
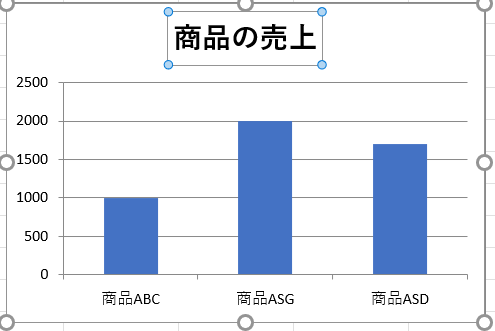
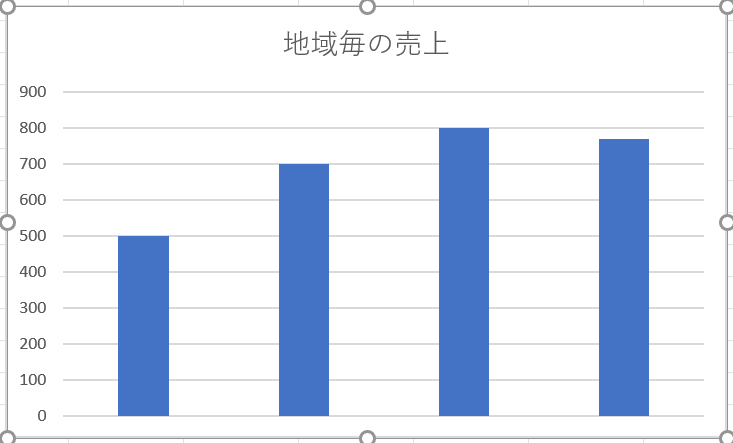
まず、Chart.SetElementメソッドでチャートタイトルを追加し、ChartTitle.Textプロパティを設定してチャートタイトルのテキストを指定する必要があります。 次のコードは、チャートのタイトルを追加し、アクティブなチャートのタイトルテキストを指定する方法です。
Sub AddingAndSettingAChartTitle()

ActiveChart.SetElement (msoElementChartTitleAboveChart)
    ActiveChart.ChartTitle.Text = "商品の売上"

End Sub
結果は以下のようになります。
注:ActiveChartオブジェクトをコードで使用する場合、まずチャートを選択し、それをアクティブなチャートにする必要があります。
VBAによるチャートの背景色の変更
下図のように、ワークシートでチャートを選択しています。
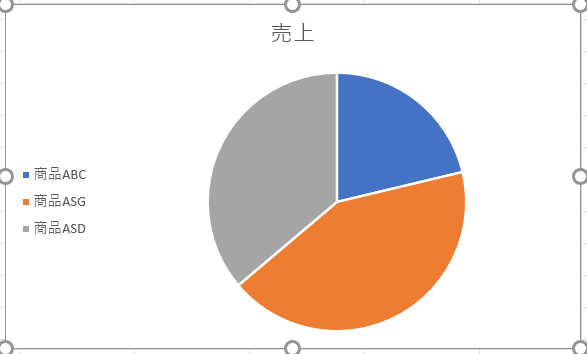
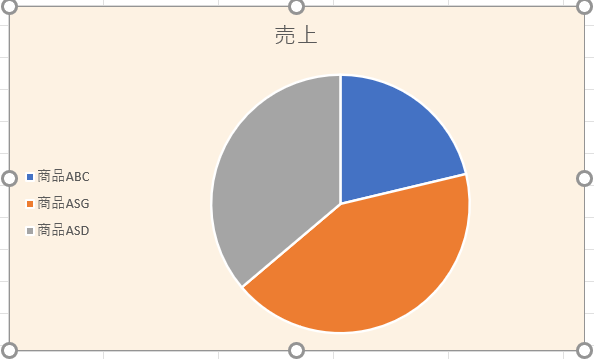
ChartAreaオブジェクトのFillFormatオブジェクトのRGBプロパティを設定することで、チャート全体の背景色を変更することができます。次のコードでは、チャートの背景色を薄いオレンジ色にします。
Sub AddingABackgroundColorToTheChartArea()

ActiveChart.ChartArea.Format.Fill.ForeColor.RGB = RGB(253, 242, 227)

End Sub
結果は以下のようになります。
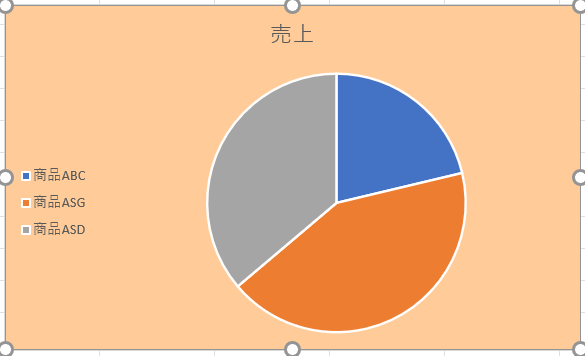
また、ChartAreaオブジェクトのInteriorオブジェクトのColorIndexプロパティを設定することで、チャート全体の背景色を変更することができます。次のコードは、チャートの背景色をオレンジ色にするものです。
Sub AddingABackgroundColorToTheChartArea()

ActiveChart.ChartArea.Interior.ColorIndex = 40

End Sub
結果は以下のようになります。
注:ColorIndexプロパティは、定義済みパレットの中から、1〜56の値に基づいて色を指定することができます。値と色の対応については、こちらをご覧ください。
VBAによるチャートプロット領域の色の変更
下図のように、ワークシートでチャートを選択しています。
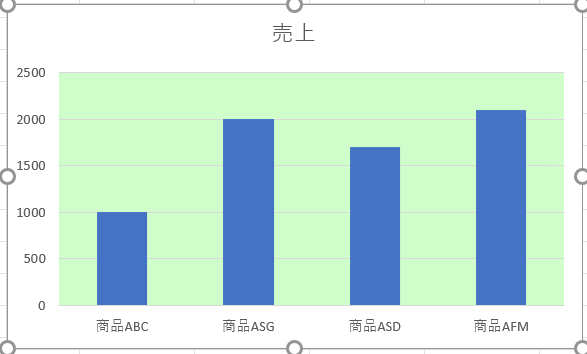
PlotAreaオブジェクトのFillFormatオブジェクトのRGBプロパティを設定することで、チャートのプロットエリアだけの背景色を変更することができます。以下のコードでは、チャートのプロットエリアの背景色をライトグリーンにします。
Sub AddingABackgroundColorToThePlotArea()

ActiveChart.PlotArea.Format.Fill.ForeColor.RGB = RGB(208, 254, 202)

End Sub
結果は以下のようになります。
VBAによる凡例の追加
以下のように、ワークシートでチャートが選択されている状態であるとしましょう。
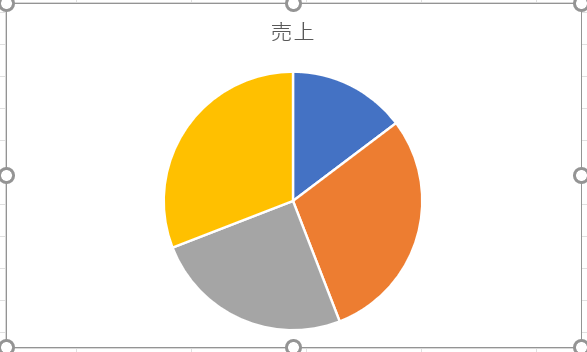
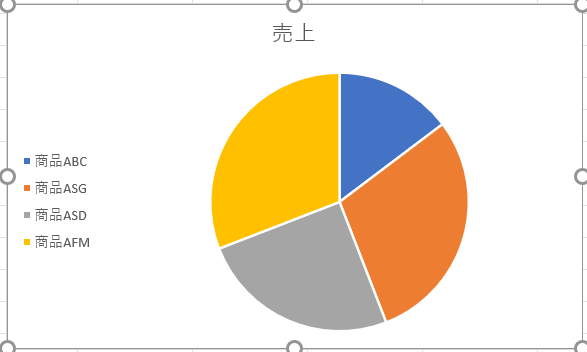
Chart.SetElementメソッドを使えば、凡例を追加することができます。以下のコードでは、チャートの左側に凡例を追加しています。
Sub AddingALegend()

ActiveChart.SetElement (msoElementLegendLeft)

End Sub
結果は以下のようになります。
凡例の位置は、以下の方法で指定することができます。
- msoElementLegendLeft – チャートの左側に凡例を表示します。
- msoElementLegendLeftOverlay – チャートの左側に凡例を重なるように表示します。
- msoElementLegendRight – チャートの右側に凡例を表示します。
- msoElementLegendRightOverlay – チャートの右側に凡例を重なるように表示します。
- msoElementLegendBottom – チャートの底に凡例を表示します。
- msoElementLegendTop – チャートの一番上に凡例が表示します。
VBAによるデータラベルの追加
以下のように、ワークシートでチャートを選択しています。
データラベルを追加するには、Chart.SetElementメソッドを使用します。次のコードは、チャートの内側の端にデータラベルを追加します。
Sub AddingADataLabels()

ActiveChart.SetElement msoElementDataLabelInsideEnd

End Sub
結果は以下のようになります。
データラベルの配置は、以下の方法で指定できます。
- msoElementDataLabelShow – データラベルを表示します。
- msoElementDataLabelRight – データラベルをチャートの右側に表示します。
- msoElementDataLabelLeft – データラベルをチャートの左側に表示します。
- msoElementDataLabelTop – データラベルをチャートの一番上に表示します。
- msoElementDataLabelBestFit – 最も適した位置に調整します。
- msoElementDataLabelBottom – データラベルをチャートの下部に表示します。
- msoElementDataLabelCallout – データラベルをコールアウトとして表示します。
- msoElementDataLabelCenter – データラベルを中央に表示します。
- msoElementDataLabelInsideBase – データラベルを内側のベースに表示します。
- msoElementDataLabelOutSideEnd – チャートの外側の端にデータラベルを表示します。
- msoElementDataLabelInsideEnd – チャートの内側端にデータ ラベルを表示します。
VBAでX軸とタイトルを追加
以下のように、ワークシートでチャートが選択されているとします。
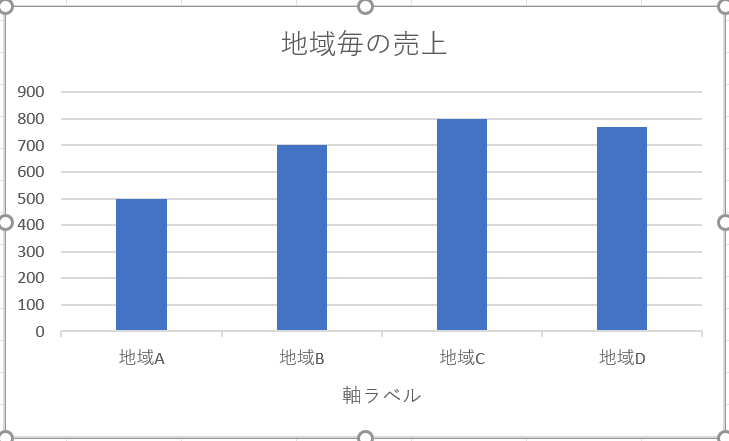
この状態でChart.SetElementメソッドを使うと、X軸とX軸のタイトルを追加することができます。次のコードは、チャートにX軸とX軸のタイトルを追加しす。
Sub AddingAnXAxisandXTitle()

With ActiveChart
.SetElement msoElementPrimaryCategoryAxisShow
.SetElement msoElementPrimaryCategoryAxisTitleHorizontal
End With

End Sub
結果は以下のようになります。
VBAでY軸とタイトルを追加
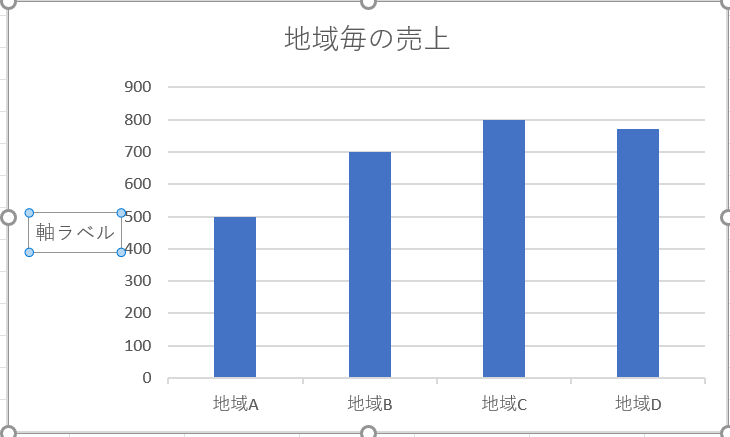
以下のように、ワークシートでチャートを選択しています。
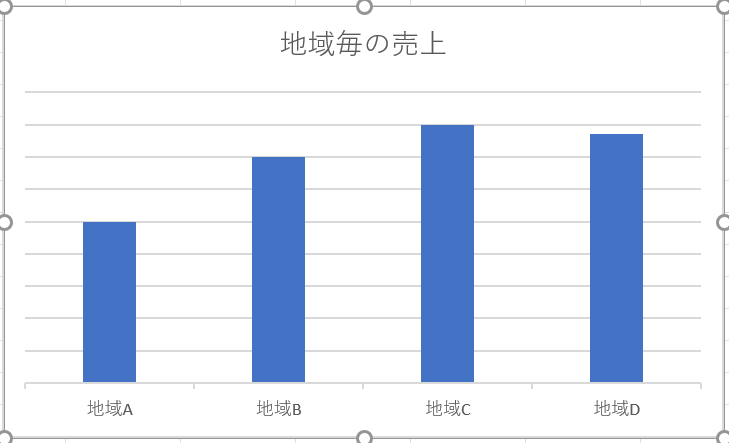
Chart.SetElementメソッドを使うと、Y軸とY軸のタイトルを追加することができます。以下のコードでは、チャートにY軸とY軸タイトルを追加しています。
Sub AddingAYAxisandYTitle()

With ActiveChart
.SetElement msoElementPrimaryValueAxisShow
.SetElement msoElementPrimaryValueAxisTitleHorizontal
End With
End Sub
結果は以下のようになります。
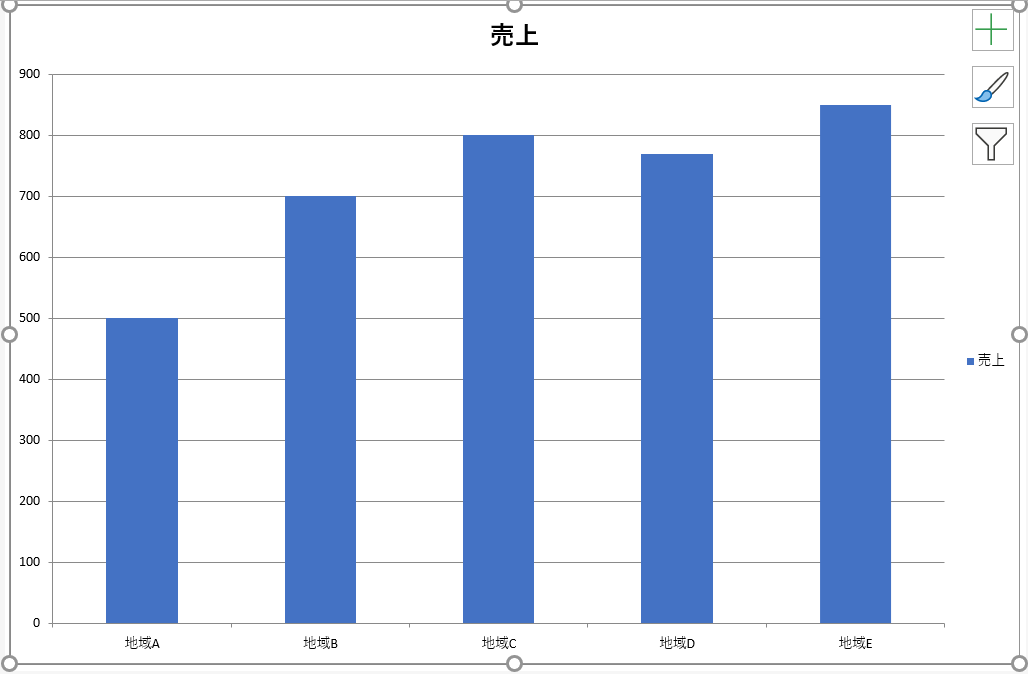
軸の数値形式の変更
ワークシートで以下のようなグラフが選択されています。
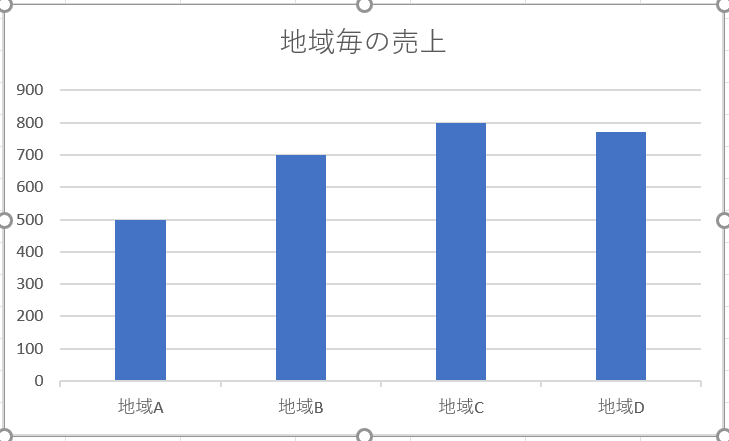
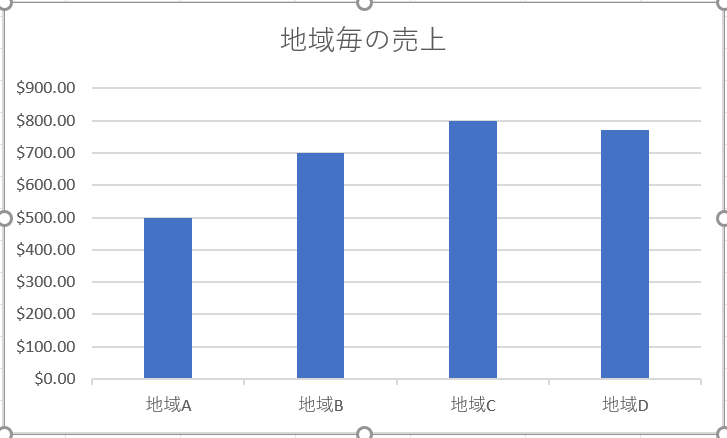
軸の数値形式を変更することができます。次のコードは、Y 軸の数値形式を通貨に変更します。
Sub ChangingTheNumberFormat()

ActiveChart.Axes(xlValue).TickLabels.NumberFormat = "\$#,##0.00"

End Sub
結果は以下のようになります。
グラフのフォントの書式の変更
ワークシートで以下のようなグラフが選択されている状態です。
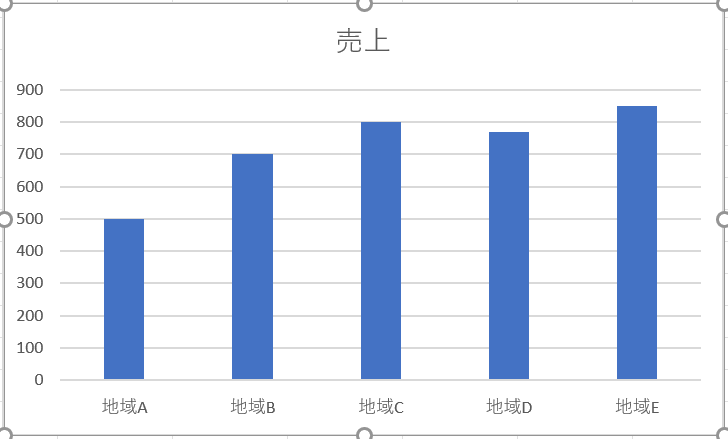
フォントオブジェクトを参照して、その名前、フォントの太さ、サイズを変更することで、チャート全体のフォントの書式を変更することができます。次のコードは、チャート全体のフォントの種類、太さ、大きさを変更するものです。
Sub ChangingTheFontFormatting()

With ActiveChart

.ChartArea.Format.TextFrame2.TextRange.Font.Name = "Times New Roman"
.ChartArea.Format.TextFrame2.TextRange.Font.Bold=True
.ChartArea.Format.TextFrame2.TextRange.Font.Size=14

End With

End Sub
結果は以下のようになります。
VBAを使ったグラフの削除
以下のように、ワークシートでチャートを選択しています。
このグラフを削除するには、次のコードを使います。
Sub DeletingTheChart()

ActiveChart.Parent.Delete

End Sub
ChartObjects コレクションの参照
ChartObjectsコレクションを参照することで、ワークシートやワークブックに埋め込まれているすべてのチャートにアクセスすることができます。ここでは、同じシートに2つのグラフがある場合を見てみましょう。
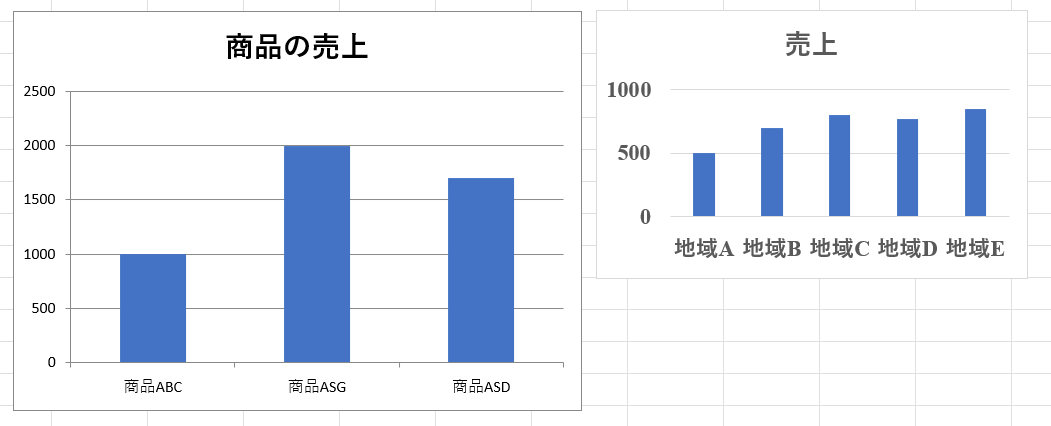
ここでは、ChartObjectsコレクションを参照して、ワークシート上の両方のグラフに同じ高さ、幅、グリッド線の削除、背景色の統一、グラフのプロットエリアの色、プロットエリアの線の色を同じ色にすることを説明します。
Sub ReferringToAllTheChartsOnASheet()

Dim cht As ChartObject

For Each cht In ActiveSheet.ChartObjects
cht.Height = 144.85
cht.Width = 246.61

cht.Chart.Axes(xlValue).MajorGridlines.Delete
cht.Chart.PlotArea.Format.Fill.ForeColor.RGB = RGB(242, 242, 242)
Cht.Chart.ChartArea.Format.Fill.ForeColor.RGB = RGB(234, 234, 234)
cht.Chart.PlotArea.Format.Line.ForeColor.RGB = RGB(18, 97, 172)

Next cht

End Sub
という結果になります。 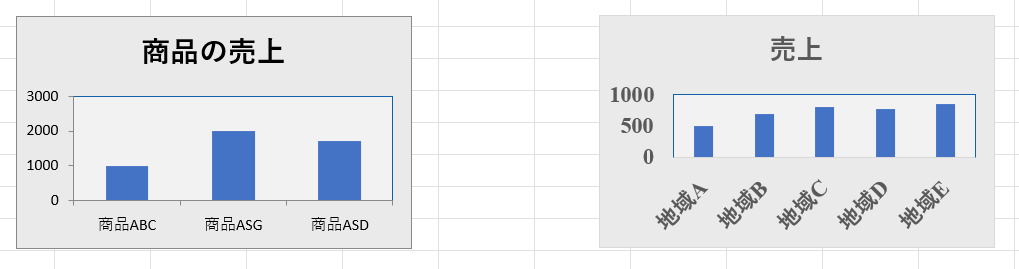
チャートを専用のシートに挿入
下図のように、ソースデータを含む範囲A1:B6があります。
Charts.Addメソッドでチャートを作成することができます。次のコードでは、独自のチャートシートにチャートを作成します。
Sub InsertingAChartOnItsOwnChartSheet()

Sheets("Sheet1").Range("A1:B6").Select
Charts.Add

End Sub
結果は以下のようになります。
他のチャート作成チュートリアルも併せてご覧ください。