Add Data Points to Existing Chart – Excel & Google Sheets
Written by
Reviewed by
Last updated on June 13, 2022
This tutorial will demonstrate how to add a Single Data Point to Graph in Excel & Google Sheets
Add a Single Data Point in Graph in Excel
Creating your Graph
- Select Data
- Click Insert
- Click Line Chart
- Select Line Chart with Markers

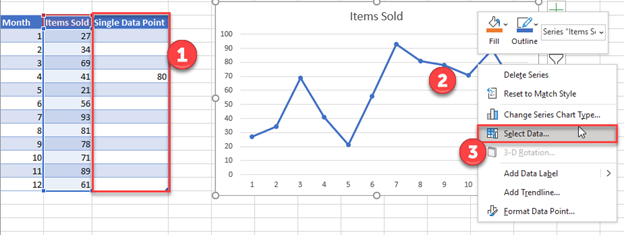
Adding Single Data point
- Add Single Data Point you would like to ad
- Right click on Line
- Click Select Data
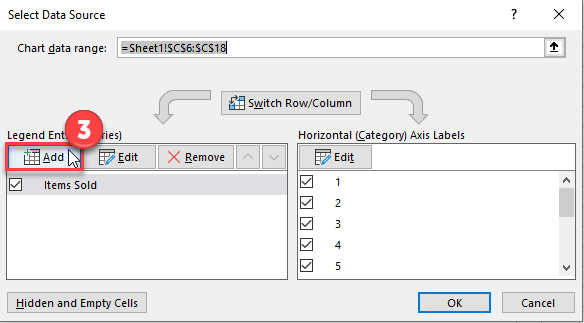
4. Select Add
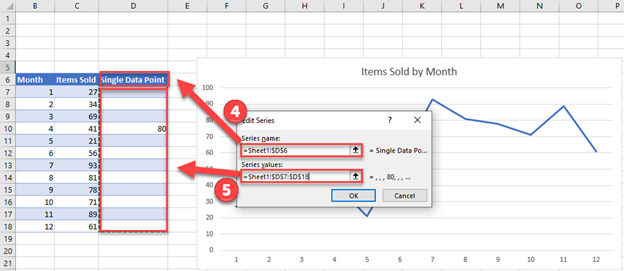
5. Update Series Name with New Series Header
6. Update Values
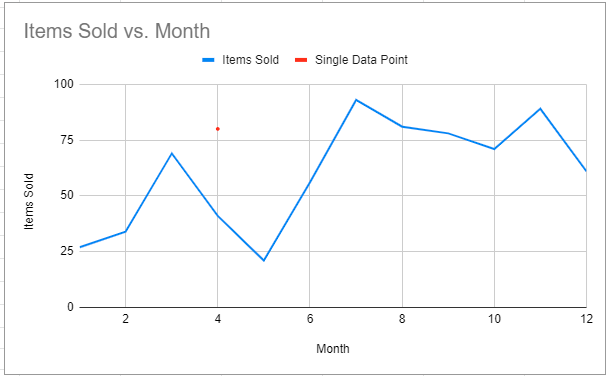
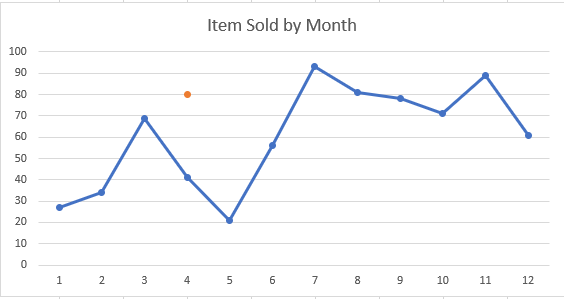
Final Graph with Single Data point
Add a Single Data Point in Graph in Google Sheets
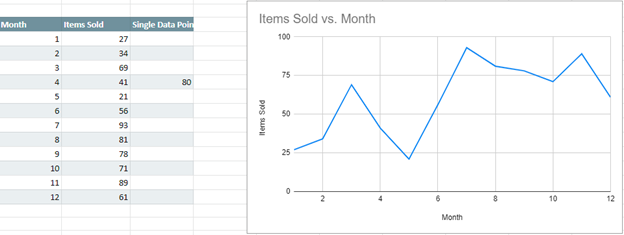
Start with your Graph
Similar to Excel, create a line graph based on the first two columns (Months & Items Sold)
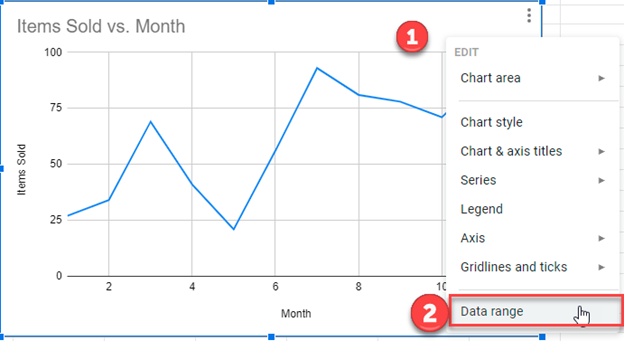
- Right click on graph
- Select Data Range
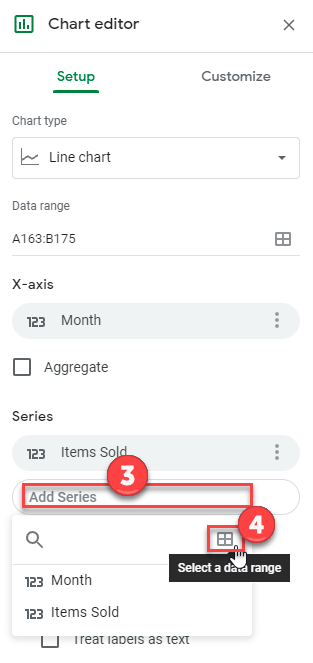
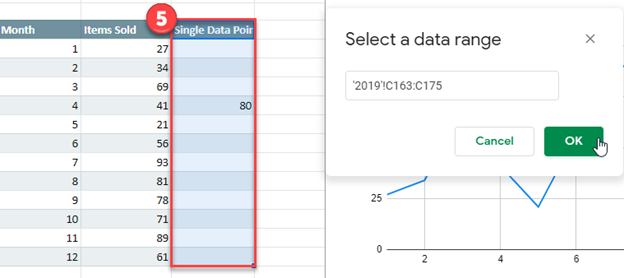
3. Select Add Series
4. Click box for Select a Data Range
5. Highlight new column and click OK.
Final Graph with Single Data Point