Calc. Area Under Curve (Trapezoidal Rule) Excel & G Sheets
Written by
Reviewed by
Calc. Area Under Curve (Trapezoidal Rule) Excel
There are several ways to calculate the area underneath a curve, but this example is going to show you how to do it using the Trapezoidal Rule.
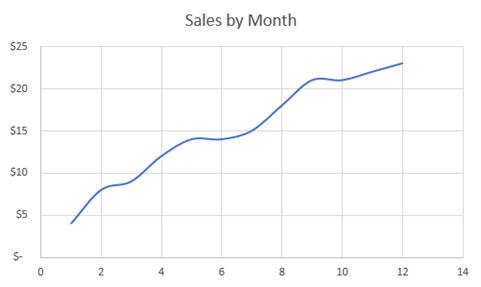
Starting with your Graph
You’ll start with your base graph that shows the relationship between the X and Y Values. The goal is to find the total area underneath the curve on the graph.
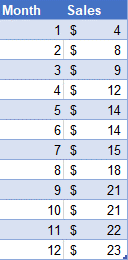
Starting with your Dataset
Next, we have the dataset that we’re working with. In this case, Month is the X Axis and Sales is the Y Axis.
Creating the Area Formula
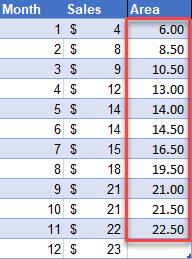
- Put in the following formula, which is a calculation to find the area under the line. As shown below, each individual formula shows the area under the graph between the data points. In this case, we type ((Y Value 2) + (Y Value 1)) / 2 * (X Value 2 – X Value 1)
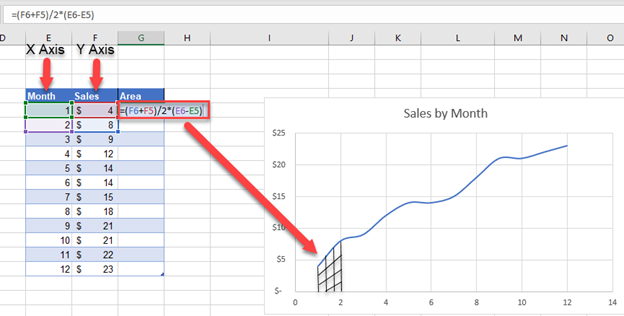
2. Drag this formula down for data except the last data point
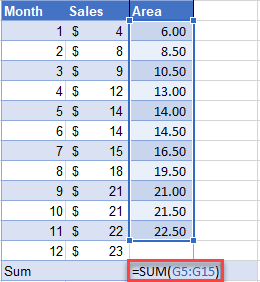
3. In an empty cell below, sum all of the individual area formulas that you just calculated to find the area of the entire curve.
Final Area under Curve
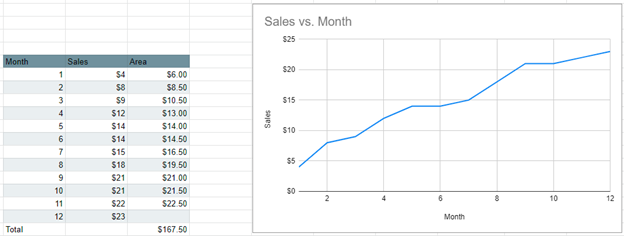
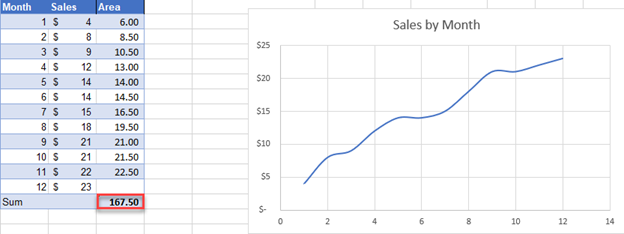
After calculating the sum, the final sum will show the total area under the curve. In this case, we get a total area of 167.50.
How to Calculate Area Under Curve (Trapezoidal Rule) in Google Sheets
In this case, calculating the area under the curve using the Trapezoidal Rule is the same in Google Sheets as in Excel. Use the same formula for the X and Y Values and you will be able to calculate the area under the curve.