Chart Axis – Use Text Instead of Numbers – Excel & Google Sheets
Written by
Reviewed by
This tutorial will demonstrate how to change Number Values to Text in Y Axis in Excel
Changing Number Values to Text in Excel
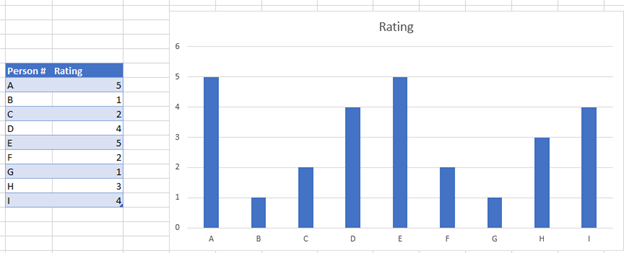
We’ll start with the below information. This graph shows each individual rating for a product between 1 and 5.
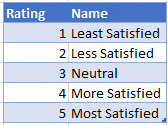
Below is the text that we would like to show for each of the ratings.
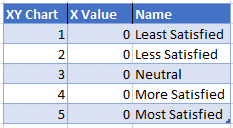
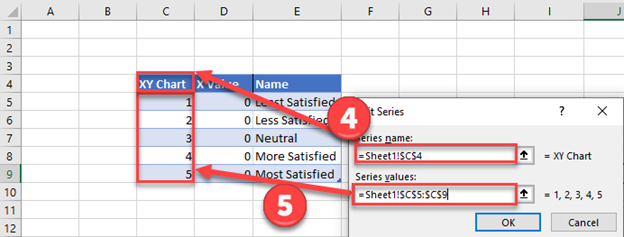
Create a table like below to show the Ratings, A column with all zeros, and the name of each
Add Ratings Series
- Right click on the Graph
- Click Select Data

3. Click on Add under Series
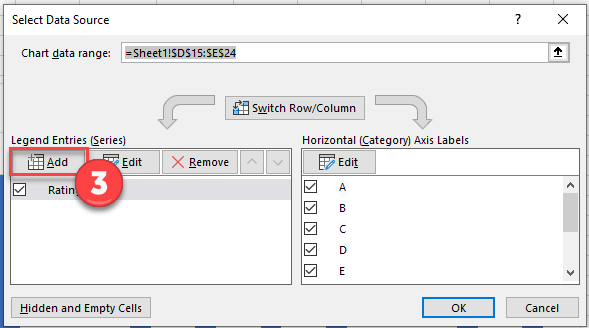
4. Select the Header for the Series Name
5. Select the Series Value for the Values and click OK.
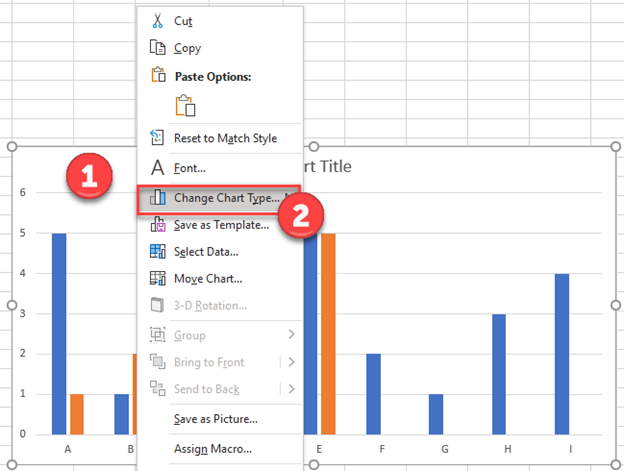
Format XY Series
- Right click Graph
- Select Change Chart Type
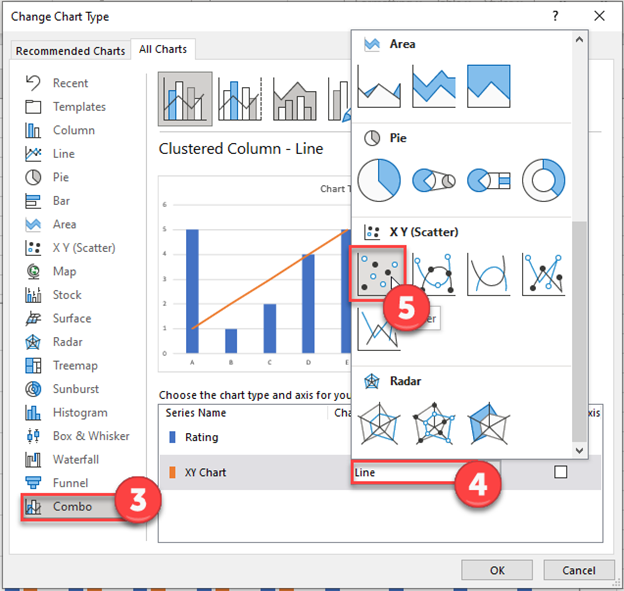
3. Click on Combo
4. Select Graph next to XY Chart
5. Select Scatterplot
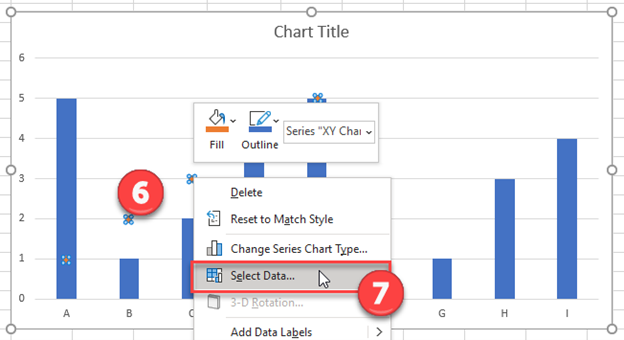
6. Select Scatterplot Series
7. Click Select Data
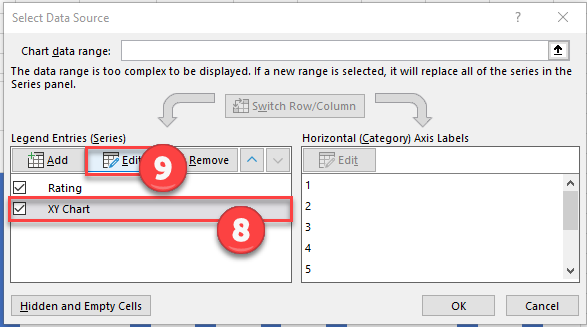
8. Select XY Chart Series
9. Click Edit
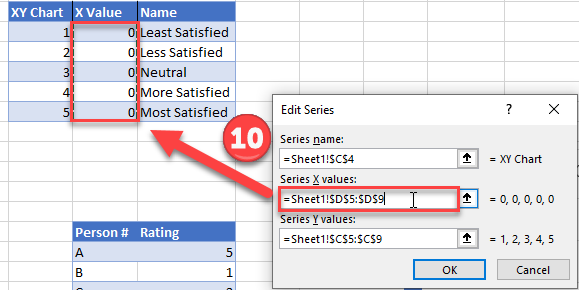
10. Select X Value with the 0 Values and click OK.
Change Labels
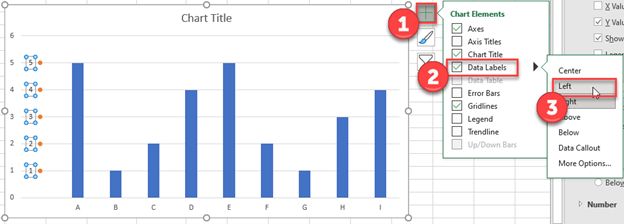
- While clicking the new series, select the + Sign in the top right of the graph
- Select Data Labels
- Click on Arrow and click Left
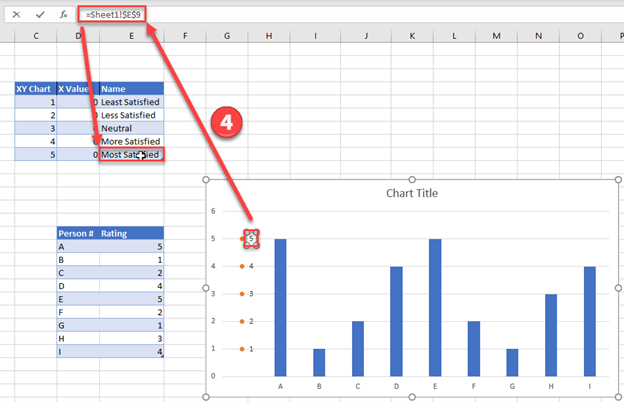
4. Double click on each Y Axis line type = in the formula bar and select the cell to reference
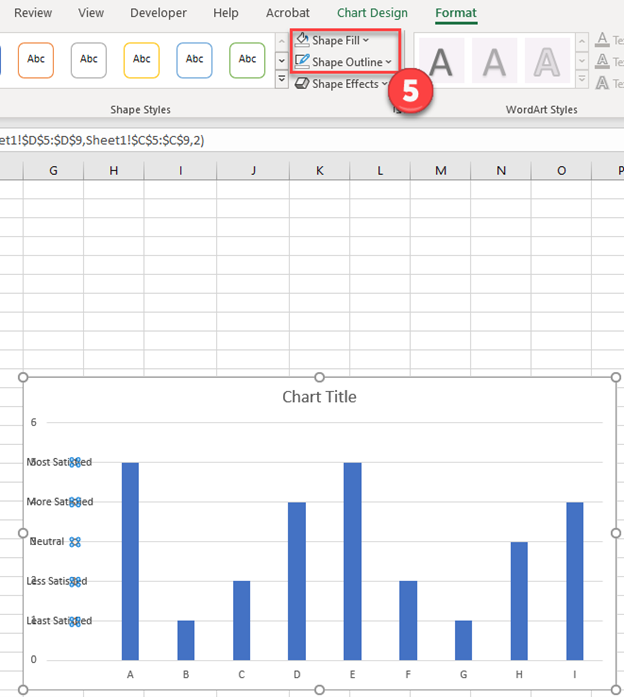
5. Click on the Series and Change the Fill and outline to No Fill
6. Click on the Original Y Axis Series with numbers and click Delete

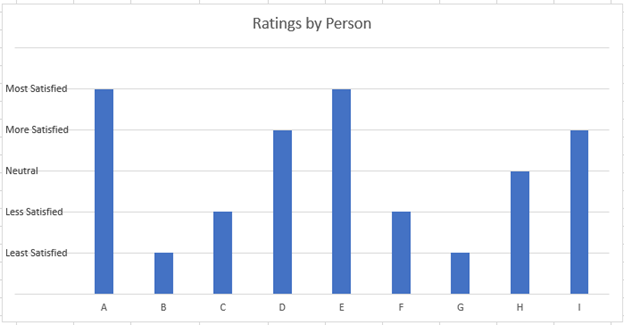
Final Graph with Numbers Replaced by Text