Create Charts with Dates or Time – Excel & Google Sheets
Written by
Reviewed by
This tutorial will demonstrate how to create charts with dates and times in Excel & Google Sheets
Create Charts with Dates or Time – Excel
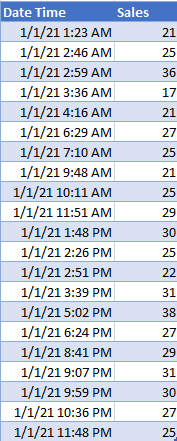
Starting with Data
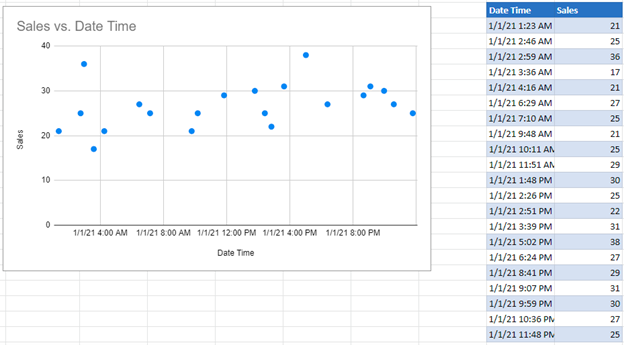
In this scenario, we want to show a graph showing the date and/or time on the X Axis and the sales on the Y Axis.
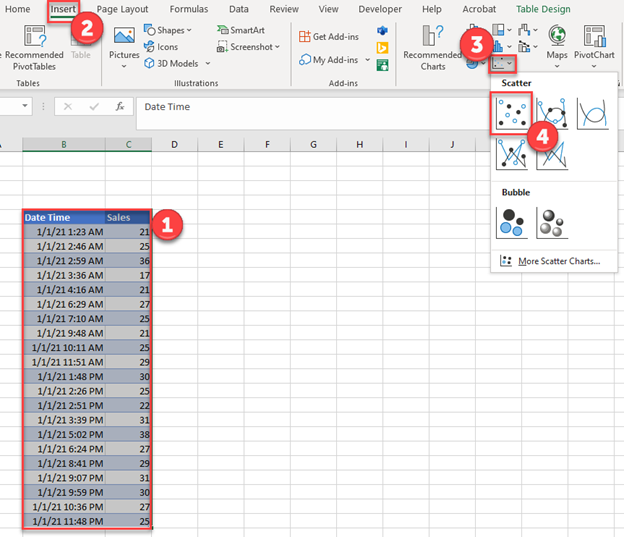
Create Scatterplot
- Highlight Data
- Click Insert
- Select Scatterplot Graphs
- Select Scatter
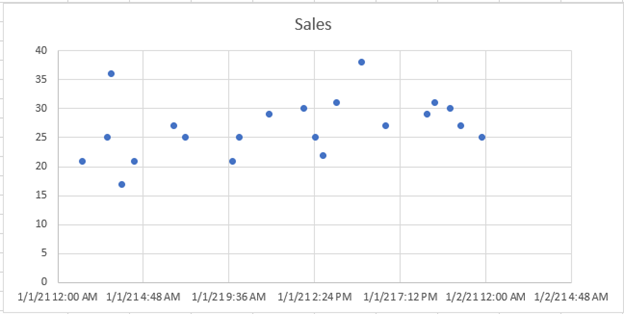
Beginning Scatterplot
We get a scatterplot like below, but first we want to format some aspects of the graph
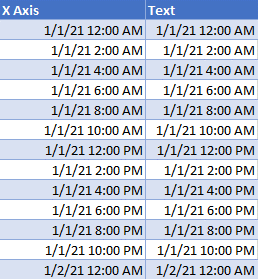
Understanding X Axis
Next, we want to understand what date and time we want on the X Axis. For this scenario, we want a tick every two hours, for a total of 12 ticks on the X Axis. Repeat this with the same information in the second column as well.
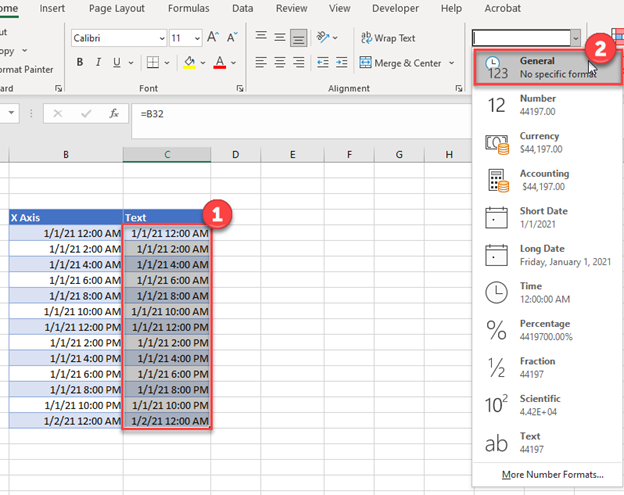
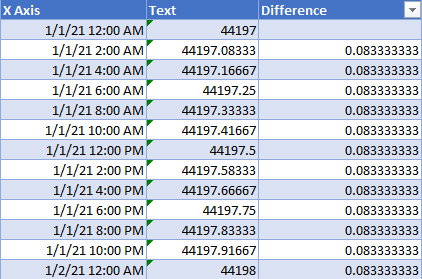
Create X Axis Table
- Highlight the second column
- Change format to General
3. Add another Column to find the difference between the two values. This will help understand how much space to leave between ticks.
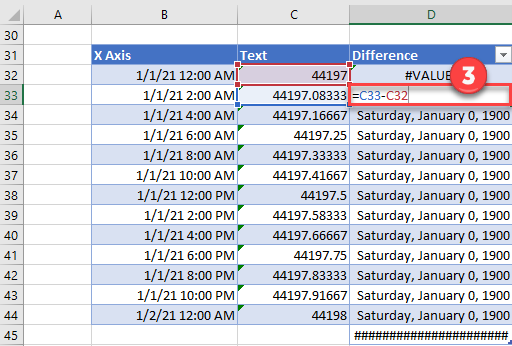
4. Change the format to General
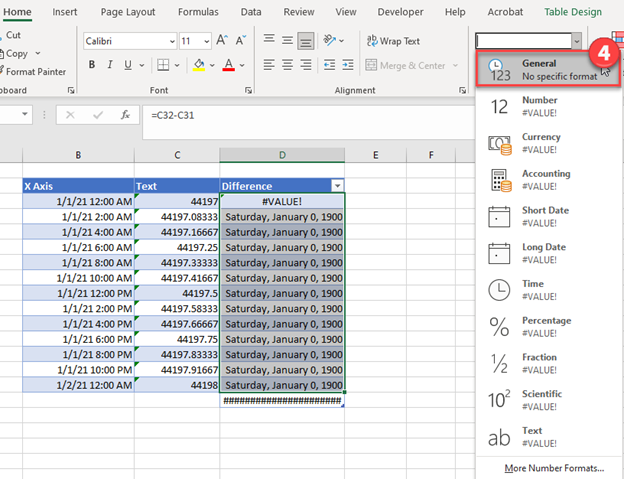
Final X Axis Table
The following table should look like the one below. This will help us to insert the parameters of the chart to show exactly how we would like to see it.
Updating X Axis
- Right Click on the X Axis
- Click Format Axis
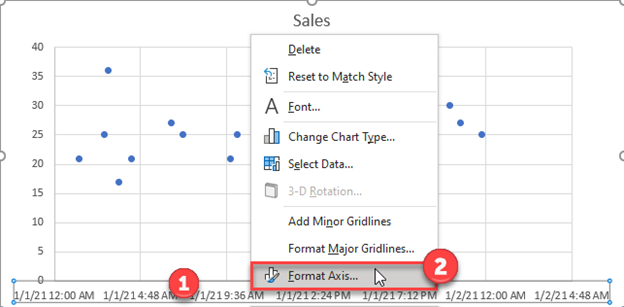
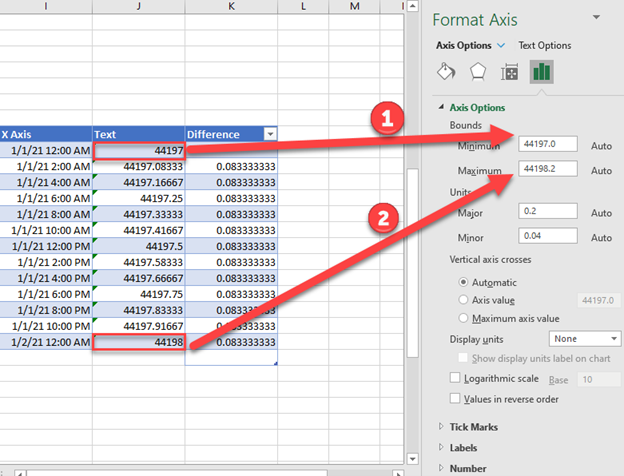
Format the Axis
- Update the Minimum Bound to be the first text value
- Update the Maximum Bound to be the last text value
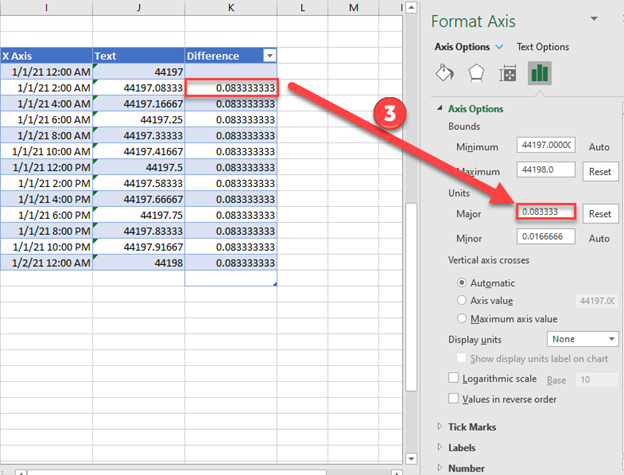
Update Major Units
- Update the Major Units to the value in the Difference Column
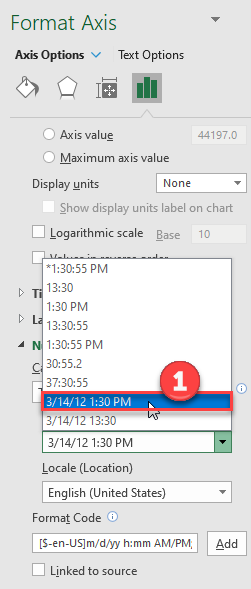
Showing Graph with Date and Time
- Change the type to date and time.
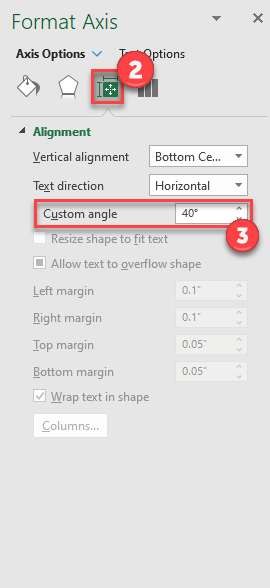
2. Click on Size and Properties icon
3. Customize your angle so it is shown on a slant so that it’s easier to see
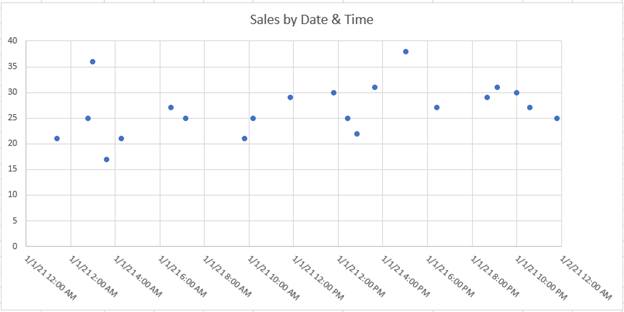
Final Graph with Date and Time
Create Charts with Dates or Time – Google Sheets
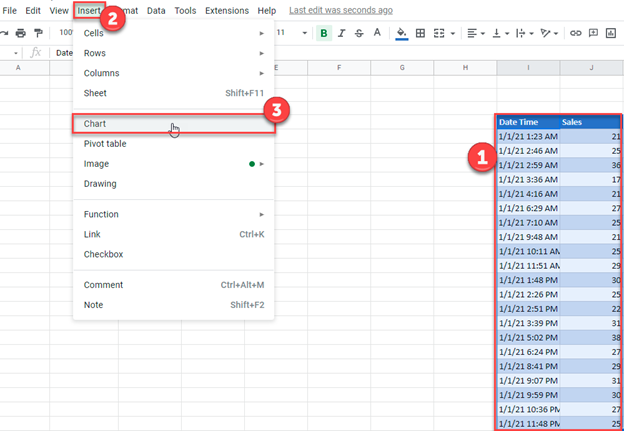
Using the same data as before, we’ll create a similar graph in Google Sheets.
- Highlight data
- Select Insert
- Click on Chart
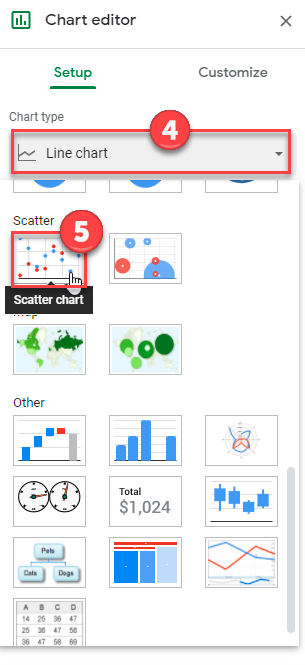
4. Under Setup on Chart Editor, Select Chart Type
5. Change to Scatter Chart
Final Graph with Date and Time