How to Make a Dot Plot in Excel
Written by
Reviewed by
This tutorial will demonstrate how to create a Dot Plot in Excel.
Create Dot Plot in Excel
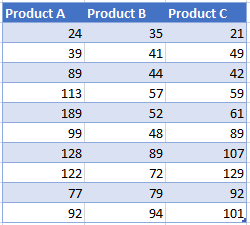
We’ll start with the table below, showing data for 3 products:
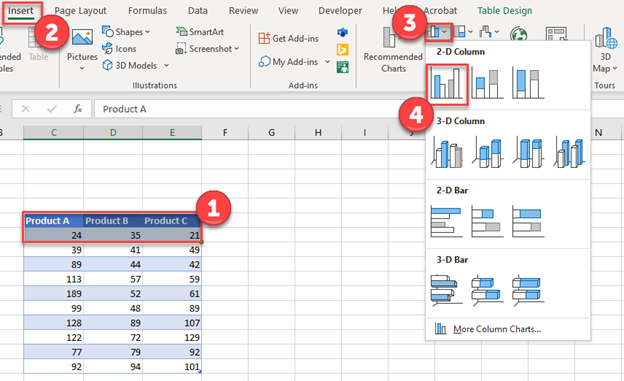
Create a Clustered Column Graph
- Highlight the header and the first row of data
- Click Insert
- Select the Bar Graph Icon
- Select the first Column Graph
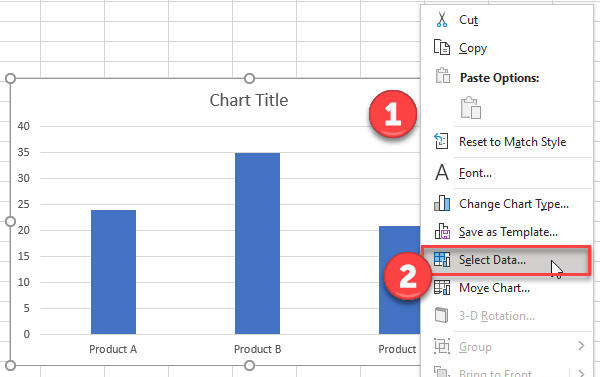
Customizing the Graph
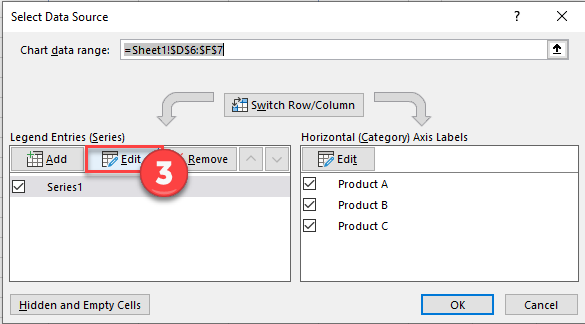
- Right click on Graph
- Click Select Data
3. Select Edit
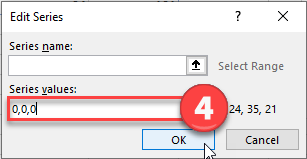
4. In Series Values, type 0,0,0 based on how many headers you have. In this case, we have three.
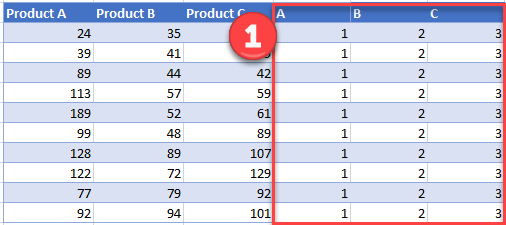
Customizing the Table
- Add Columns to the table for however many headers you have. In the first Column, enter all 1’s, then all 2’s, and then all 3’s.
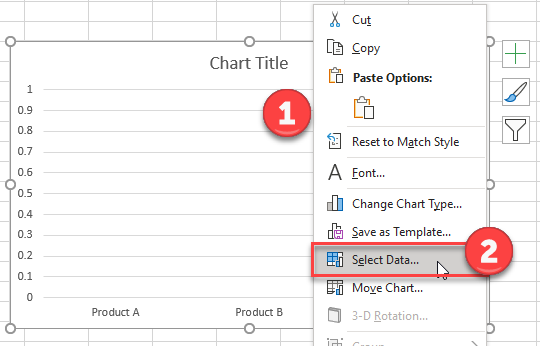
Adding Another Dataset
- Right click on the graph
- Click Select Data
3. Select Add
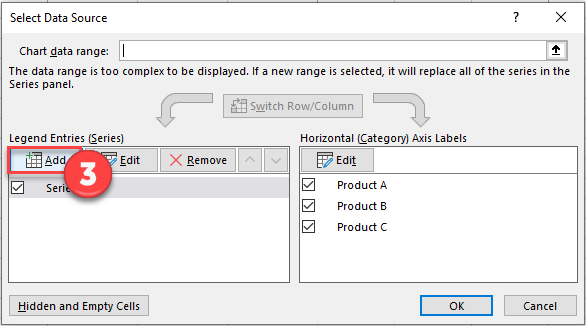
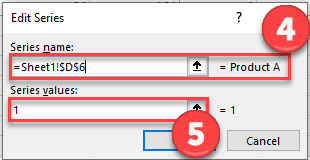
4. Select the first header name for Series Name
5. Type 1 for Series Values
Update Dataset
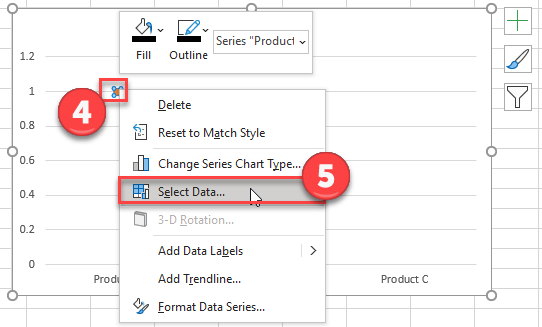
- Right click on graph
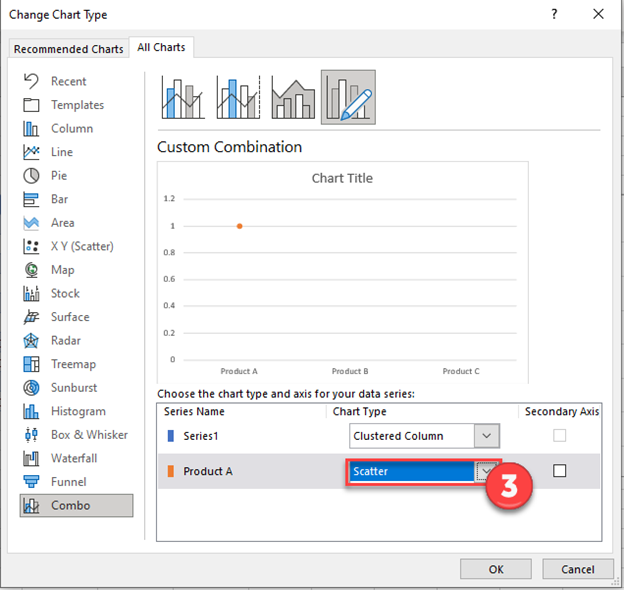
- Select Change Series Chart Type
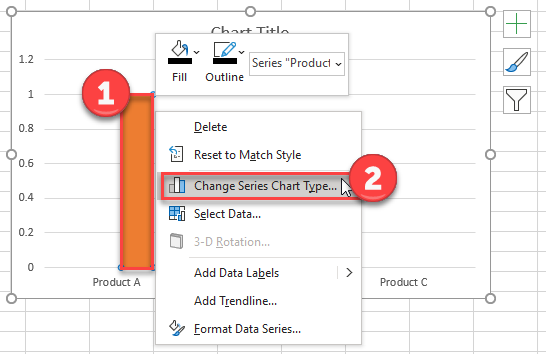
3. Change Product A to Scatterplot
4. Right click on Scatterplot Point
5. Click Select Data
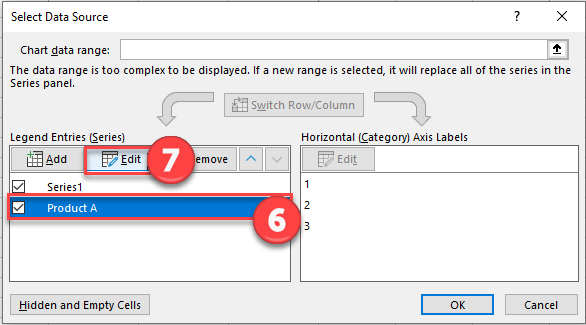
6. Click on Product A
7. Select Edit
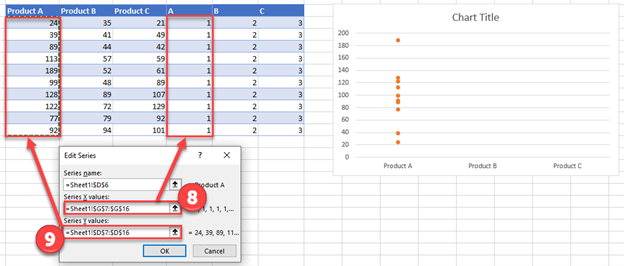
8. For X Values, select the 1’s that we created
9. For the Y Values, select the items under Product A and click OK.
Your graph should look similar to the one to the right.
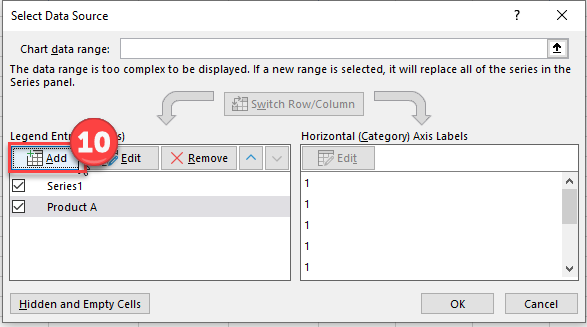
10. Click Add and add Product B & C similar to the previous step.
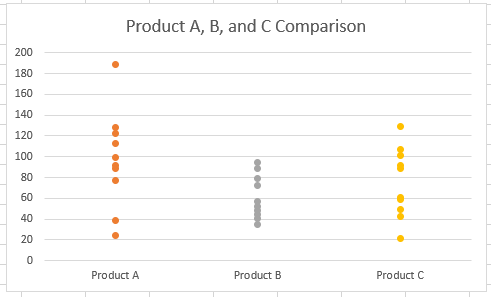
Final Dot Graph
After you repeat what you did for Product A to Product B and C, your graph should look similar to the one below.