Export Chart as PDF – Excel & Google Sheets
Written by
Reviewed by
Last updated on October 30, 2023
Export Chart as PDF – Excel
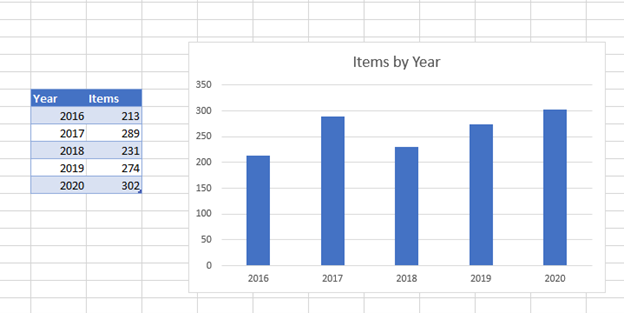
Starting with your Data
In this scenario, we’ll show how to export your graph as a PDF in Excel. We’ll start with the below information and want to save the graph as its own graphic.
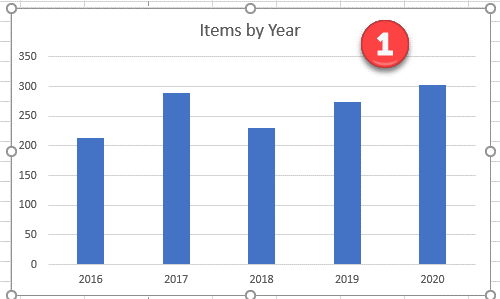
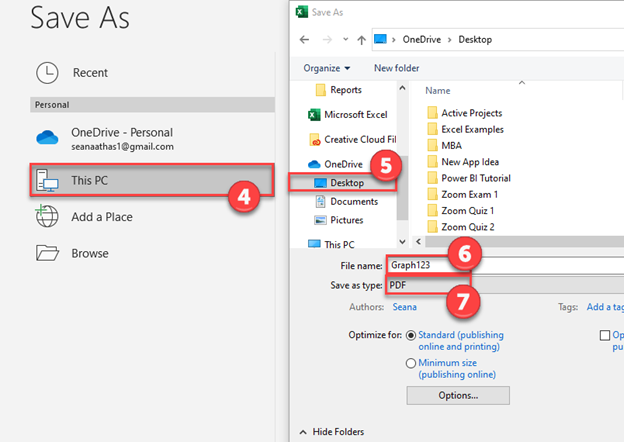
- Click on the graph
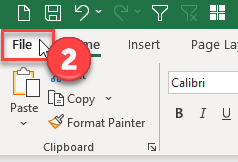
2. Select File in the top right of the Excel Sheet
3. Select Save As

4. Select This PC
5. Select where you want to save it
6. Name your Graph
7. Change Save as Type to PDF
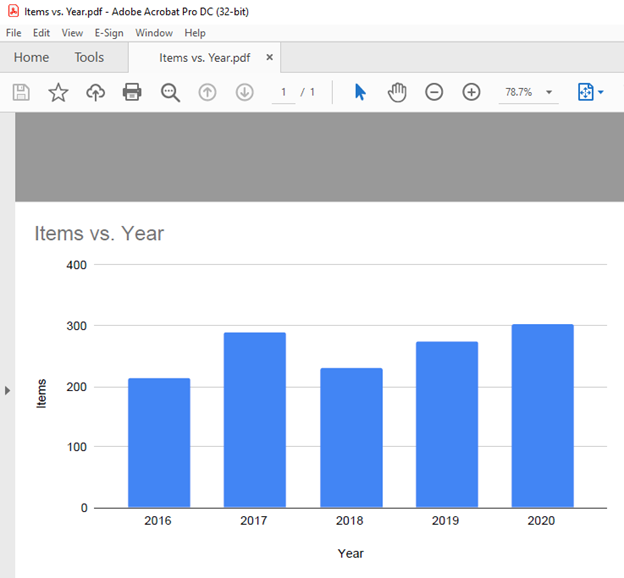
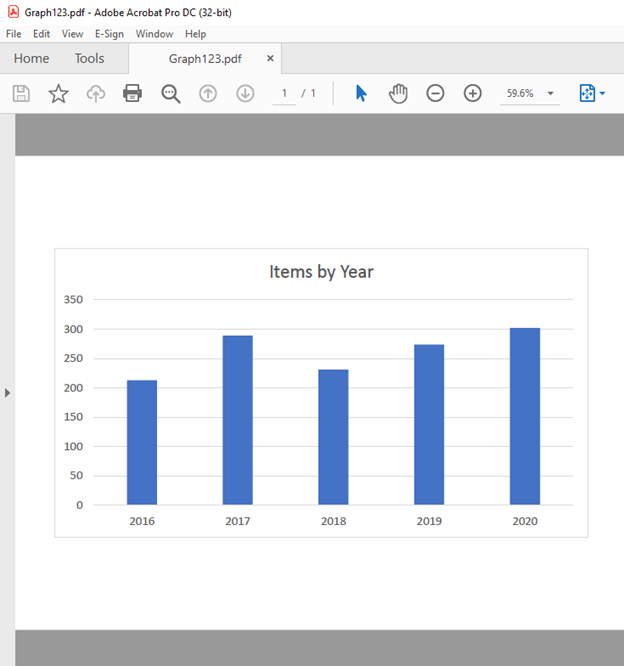
Final Graph as PDF
Once you open it, you can see the final graph saved as a PDF from Excel.
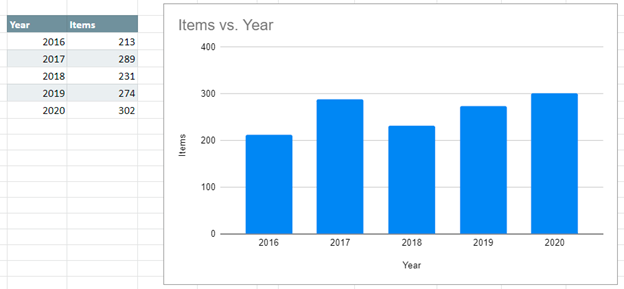
Export Chart as PDF – Google Sheets
Starting with your Data
Below, we’ll start with the same data in Google Sheets that we did in Excel.
Export Graph as PDF
- Click on Graph
- Click on three dots at top right of Graph
- Select Download
- Select PDF Document (.pdf)
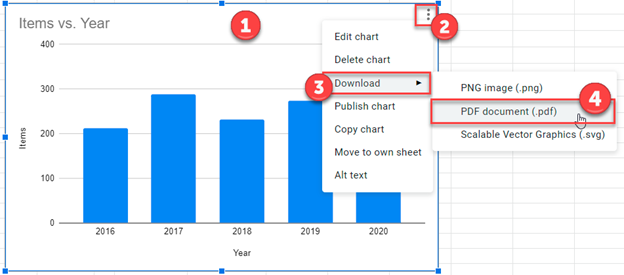
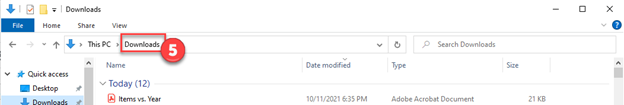
5. Open your Downloads to find the PDF
Final Graph as PDF
Below you can see the final PDF with the graph from Google Sheets.