Floating Bar Chart – Excel & Google Sheets
Written by
Reviewed by
Last updated on July 17, 2023
This tutorial will show how to create a Floating Bar Graph in Excel and Google Sheets.
Floating Bar Chart – Excel
Starting with your Data
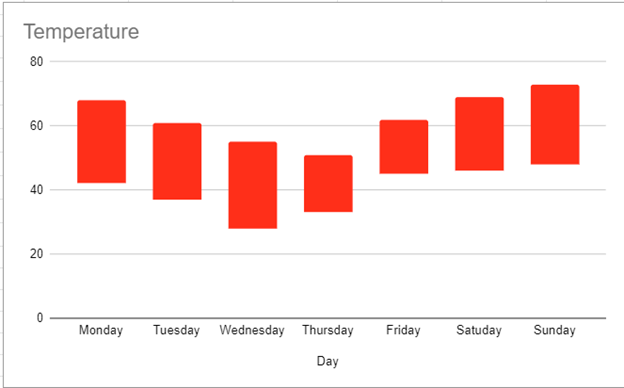
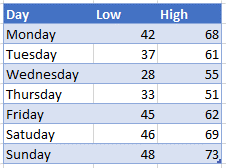
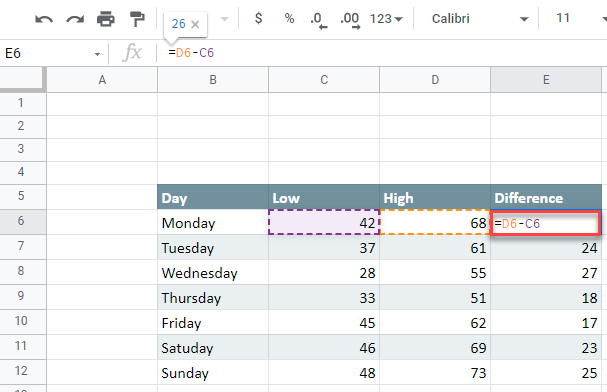
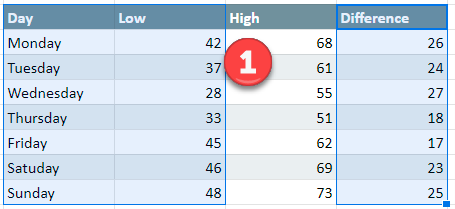
We’ll start with the below dataset that displays High and Low temperatures for each day.
Creating a Graph
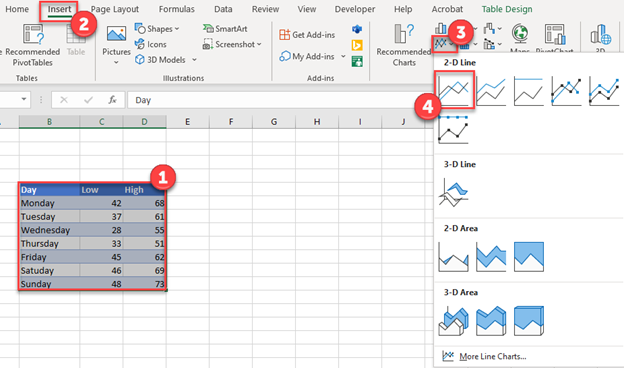
- Highlight dataset
- Select Insert
- Select Line Graph
- Click on the first 2-D Graph
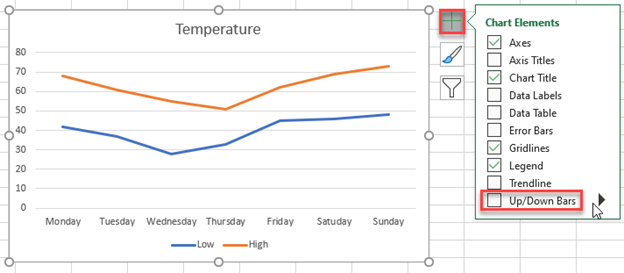
5. Click on the + Sign in the top right of the graph
6. Select the Up/Down Bars
Customizing Bars
- Select the Bar
- Click on Format at the top
- Change the Shape Fill and Outline to whatever color you’d like
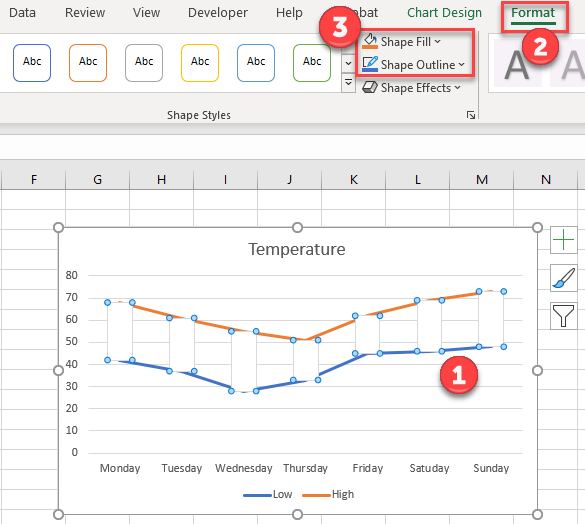
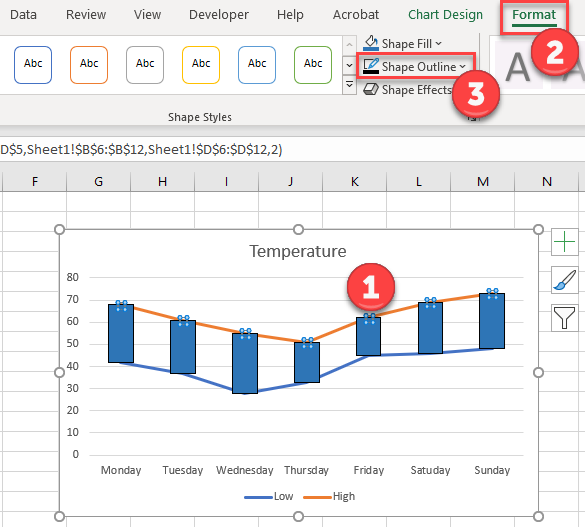
Customizing Lines
- Click on one of the lines
- Select Format
- Change Shape Outline to No Fill
Repeat for other line
Finalizing Graph
- Select the + Sign in the top right of the graph
- Uncheck
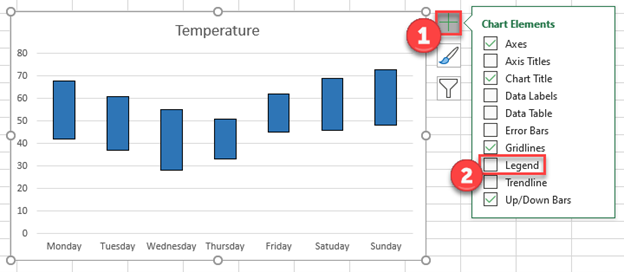
Now you have a floating bar chart.
Floating Bar Chart – Google Sheets
Customizing Table
We’ll use the same starting data as we did in Excel, however, we’re going to add another column called Difference. This will be =High-Low
Creating your Graph
- Highlight the “Day” Data. Then hold down CTRL as you highlight “Low” and “Difference”. This will highlight everything except “High”.
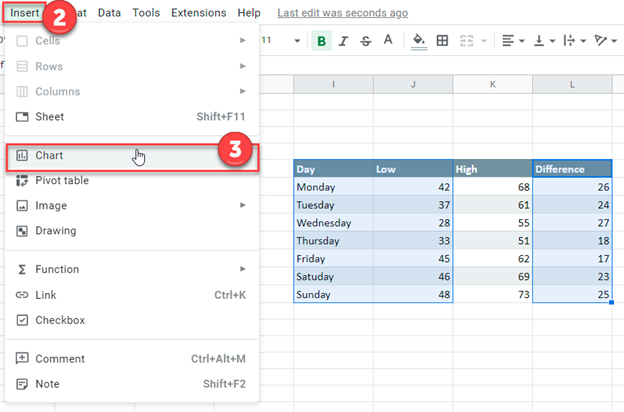
2. While highlighting those cells, select Insert
3. Click Chart
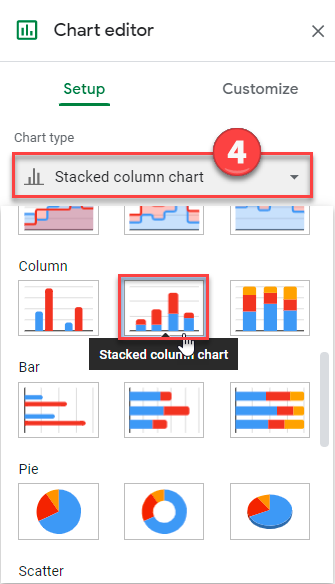
4. Change the Chart Type to the Stacked Column Chart
Customizing Graph
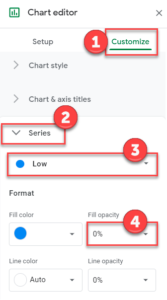
- Select Customize
- Click Series
- Select the Low Series
- Change Fill Opacity to 0%
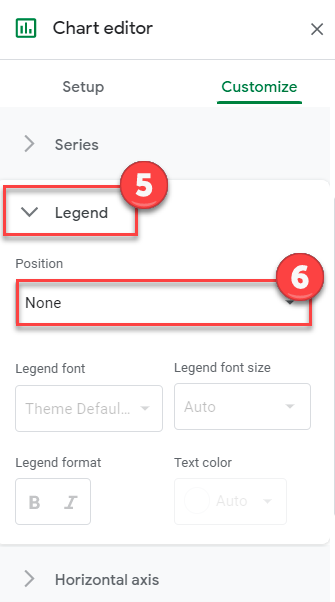
5. Click on Legend
6. Select None
Final Floating Graph
And you’ll see your floating chart in Google Sheets: