Forest Plot – Excel
Written by
Reviewed by
This tutorial will demonstrate how to create a Forest Plot in Excel.
Creating a Forest Plot in Excel
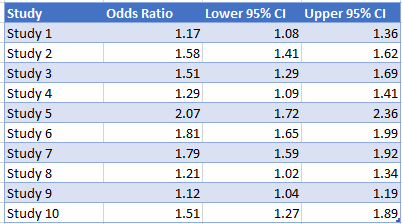
We’ll start with the below data. This dataset shows the Odds Ratio of ten different studies along with their lower and upper Confidence Intervals.
Create a Clustered Graph
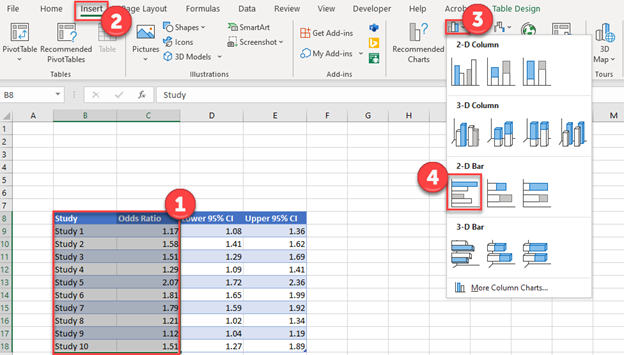
- Highlight the Study and Odds Ratio Columns
- Select Insert
- Click Bar Graphs
- Select Horizontal Clustered Graph
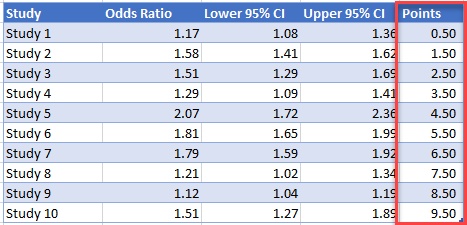
Add Points
Add a points Column that starts at .5 and add 1 to each one until you get to the ending value
Add a Series
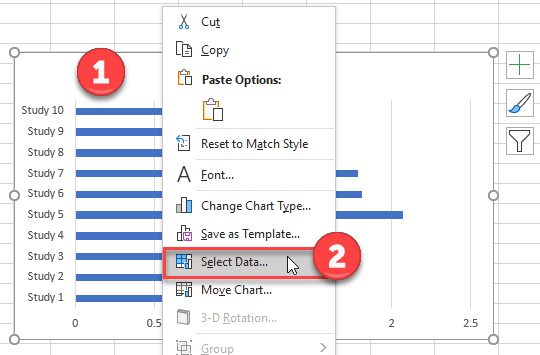
- Right click on Graph
- Click Select Data
3. Select Add Series
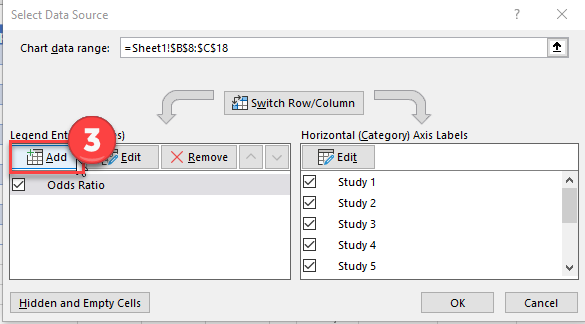
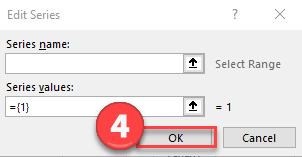
4. Leave everything blank and Click OK
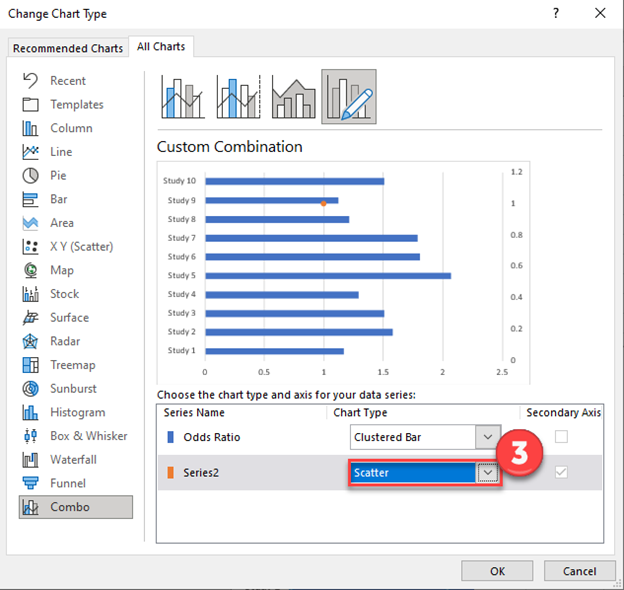
Change Chart Type
- Right click on Graph
- Select Change Chart Type
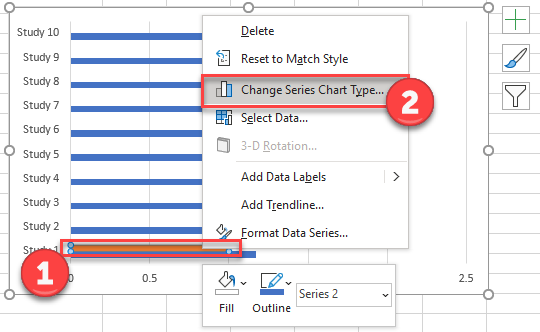
3. Change Series2 to Scatter
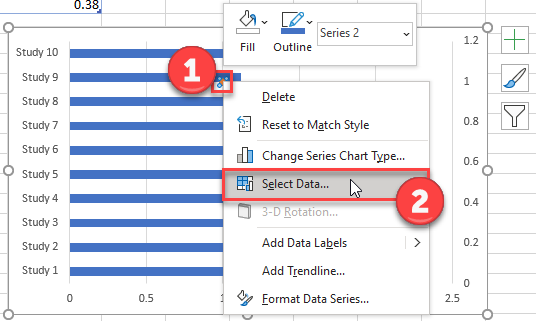
Update Series
- Click on Datapoint
- Click Select Data
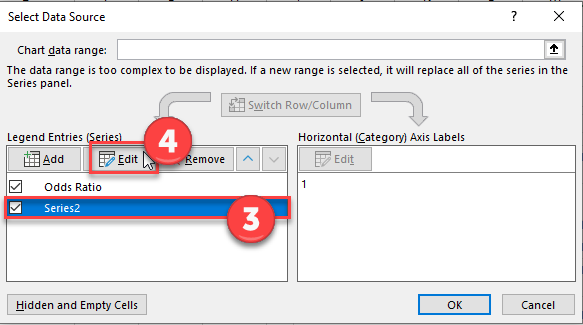
3. Click on Series2
4. Select Edit
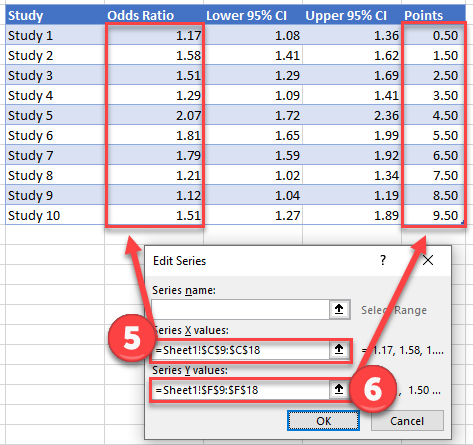
5. Select Odds Ratio for X Values
6. Select Points for Y Values
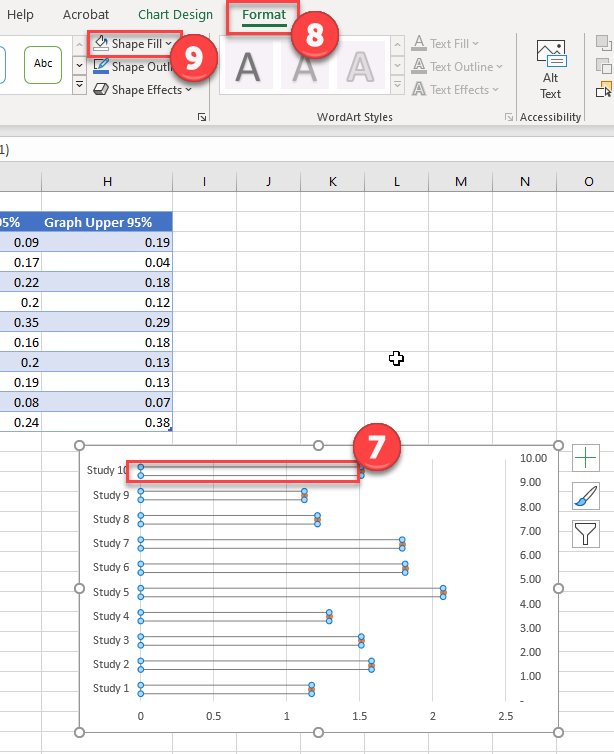
7. Click on the Bar Series
8. Select Format
9. Change Shape Fill to No Fill
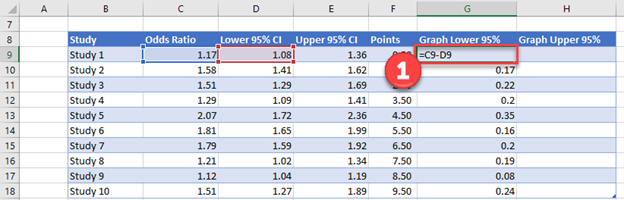
Add Error Bars
- For the Graph Lower, take Odds Ratio – Lower 95% CI
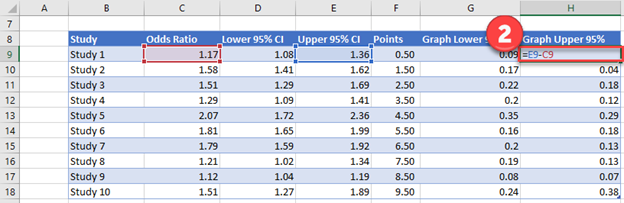
2. For the Graph Upper, take Upper 95% CI – Odds Ratio
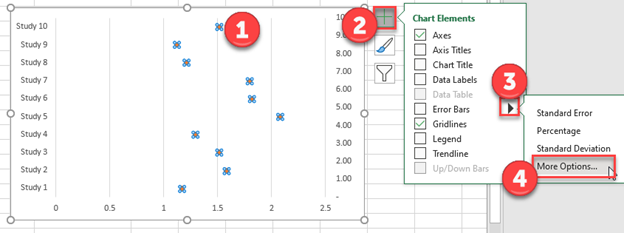
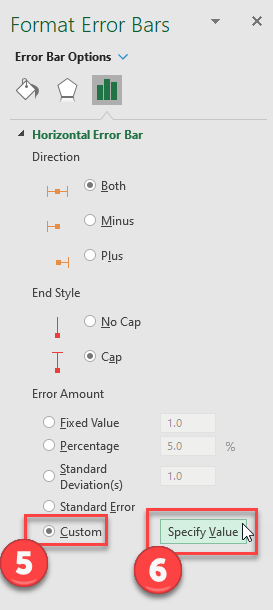
Add Error Bars
- Select Scatterplot Series
- Select + Sign in top right
- Select arrow next to Arrow Bars
- Click More Options
5. Select Custom
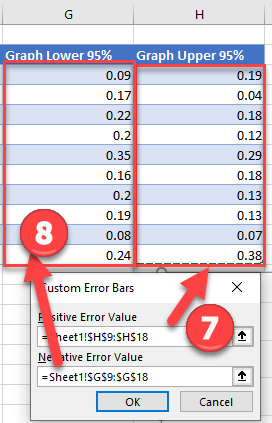
6. Click Specify Value
7. For Positive Error Values, Copy Graph Upper 95%
8. For Negative Error Value, Select Graph Lower 95%
9. Select the Vertical Line and delete to get rid of them so that we only see the horizontal error bars
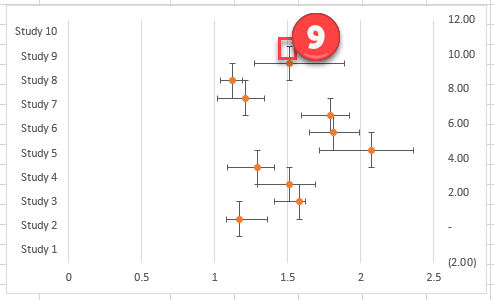
10. Delete the axis on the right side
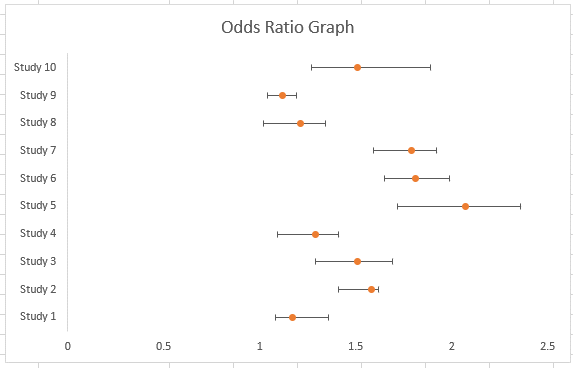
Final Graph
After making some optional adjustments, you can see the final graph below.