How to Graph an Equation / Function – Excel & Google Sheets
Written by
Reviewed by
Last updated on June 13, 2022
This tutorial will demonstrate how to graph a Function in Excel & Google Sheets.
How to Graph an Equation / Function in Excel
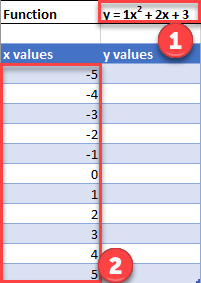
Set up your Table
- Create the Function that you want to graph
- Under the X Column, create a range. In this example, we’re range from -5 to 5
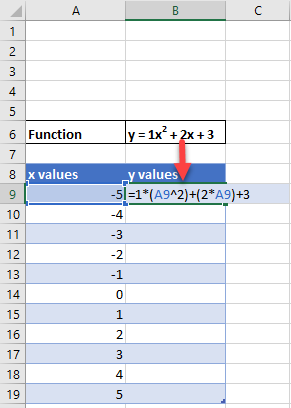
Fill in Y Column
Create a formula using the Function, substituting x with what is in Column B.
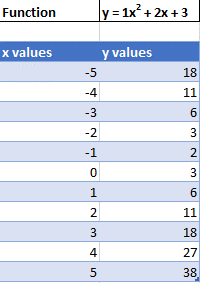
After using this formula for all the rows, you should have a table that looks like below.
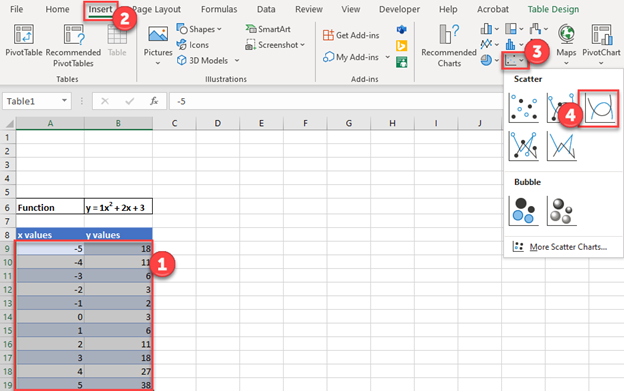
Creating Scatterplot
- Highlight Dataset
- Select Insert
- Select Scatterplot
- Select Scatter with Smooth Lines
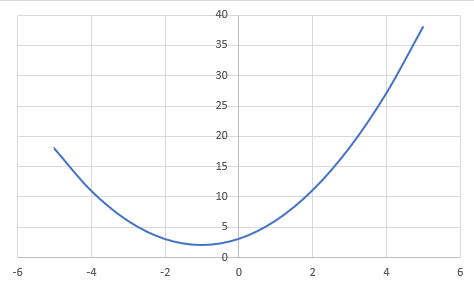
This will create a graph that should look similar to below.
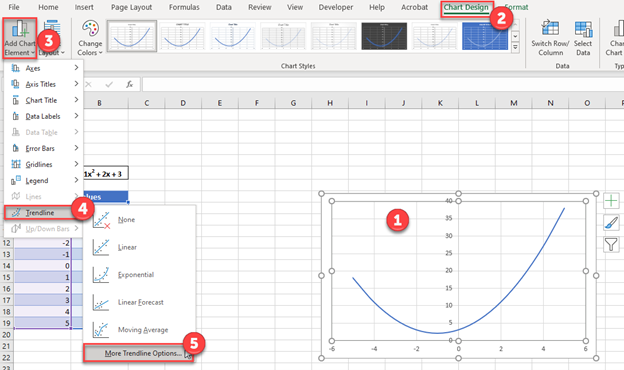
Add Equation Formula to Graph
- Click Graph
- Select Chart Design
- Click Add Chart Element
- Click Trendline
- Select More Trendline Options
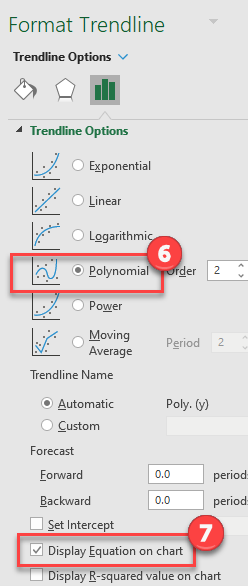
6. Select Polynomial
7. Check Display Equation on Chart
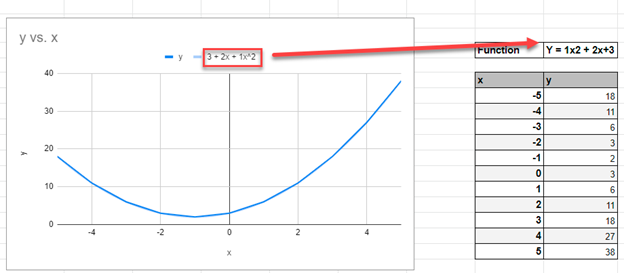
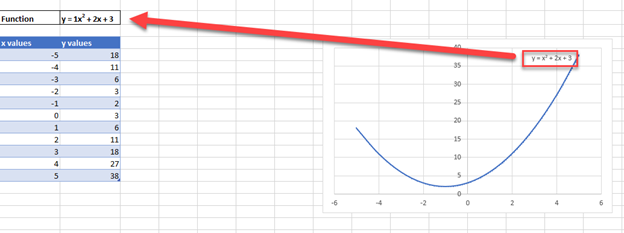
Final Scatterplot with Equation
Your final equation on the graph should match the function that you began with.
How to Graph an Equation / Function in Google Sheets
Creating a Scatterplot
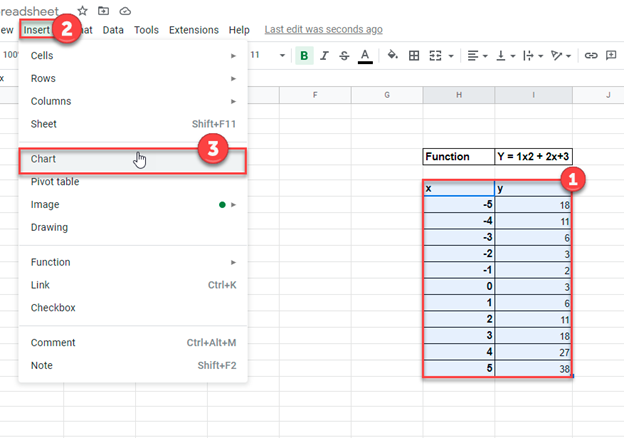
- Using the same table that we made as explained above, highlight the table
- Click Insert
- Select Chart
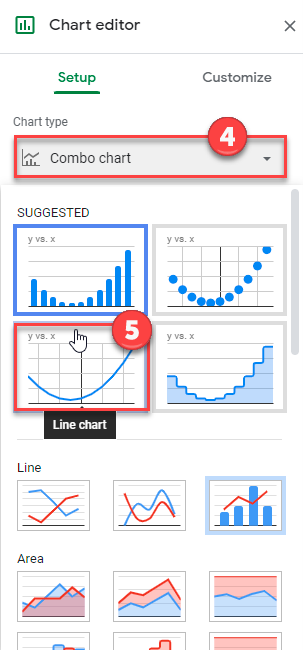
4. Click on the dropdown under Chart Type
5. Select Line Chart
Adding Equation
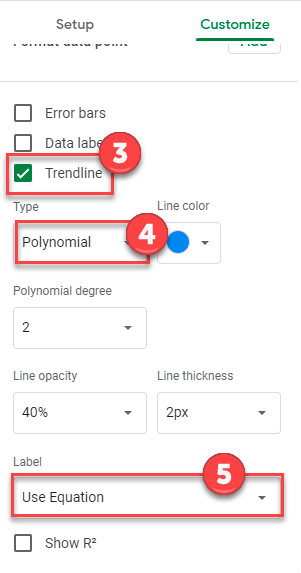
- Click on Customize
- Select Series
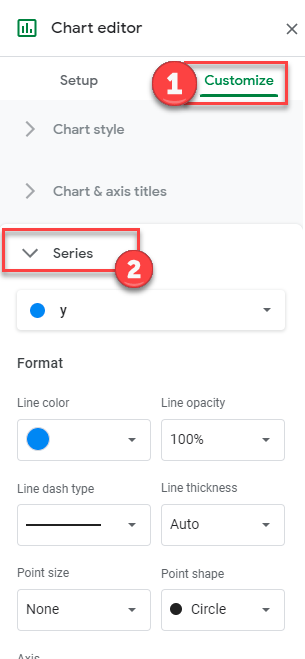
3. Check Trendline
4. Under Type, Select Polynomial
5. Under Label, Select Use Equation
Final Scatterplot with Equation
As you can see, similar to the exercise in Excel, the equation matches the function that we began with.