Insert Textbox to a Chart – Excel & Google Sheets
Written by
Reviewed by
Last updated on October 30, 2023
In this tutorial, we will demonstrate how to add a textbox to a graph in Excel and Google Sheets.
Adding a Textbox to a Graph in Excel
Starting with your Graph
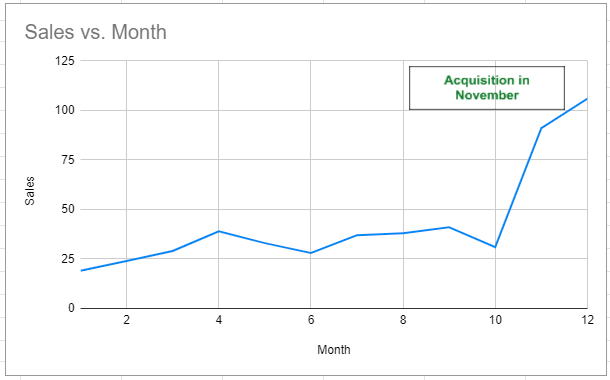
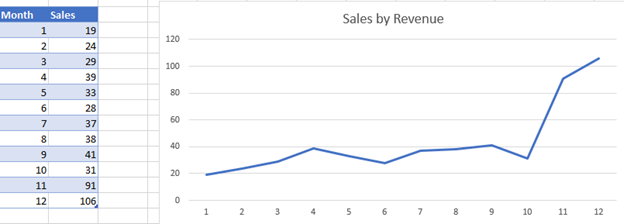
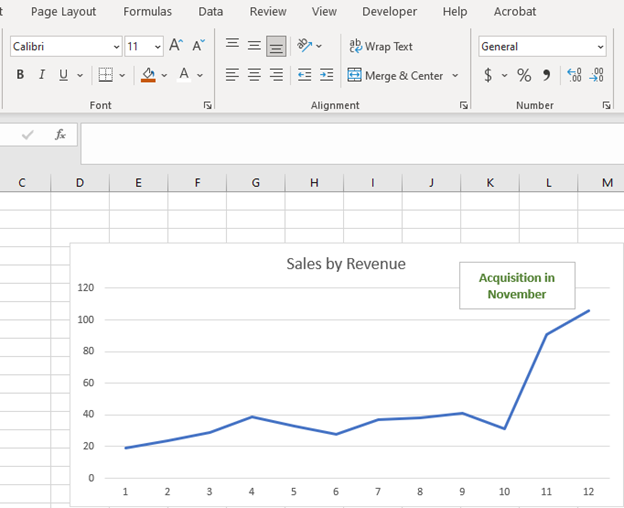
We’ll start with the below graph. As you can see, there is a large increase in Month 11. In this scenario, we’ll show how to add a textbox to the graph.
Adding Textbox
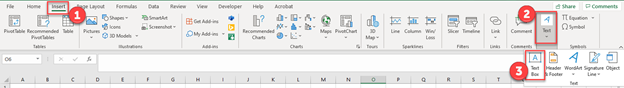
- Click Insert
- Select Text
- Click Text Box
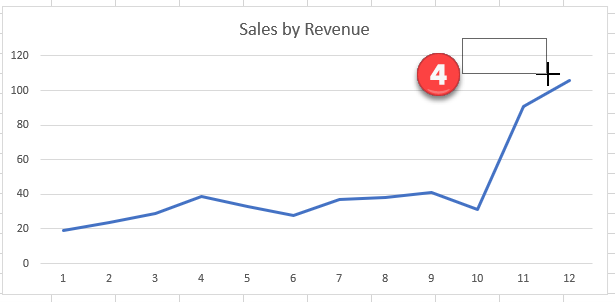
4. Drag where you would like the textbox to be
Final Textbox on Graph
After typing in the Text Box and formatting it as appropriate, you will have a final textbox that helps gives key information about the graph.
Adding a Textbox to a Graph in Google Sheets
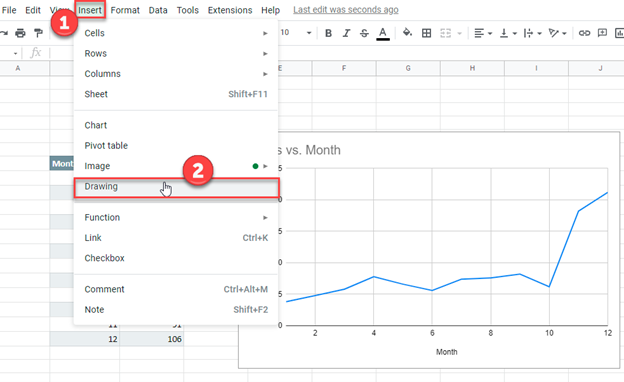
Using the same data from the Excel tutorial, we’ll add a textbox to the graph in Google Sheets
- Click Insert
- Select Drawing
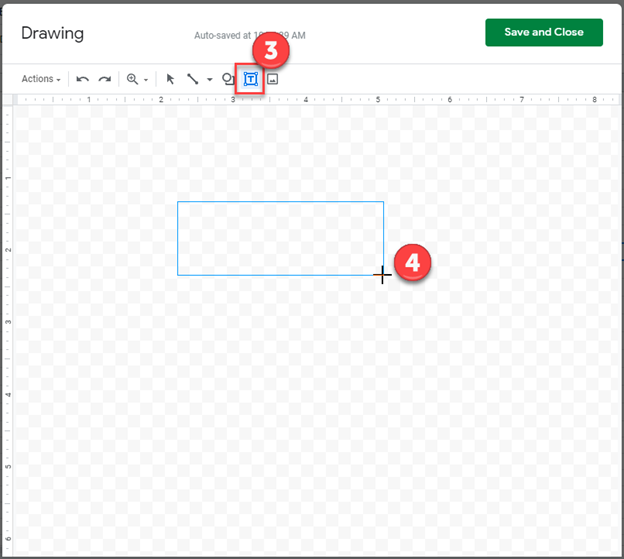
3. Click on the Textbox tool
4. Drag to create a textbox on the checkered background
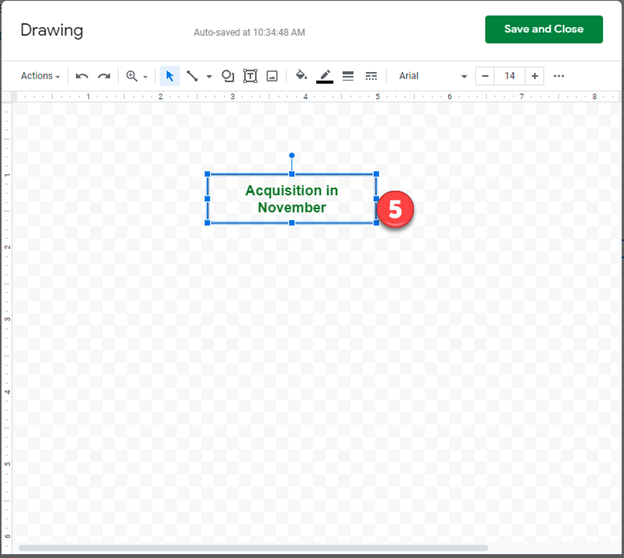
5. Type and Format the textbox that you would like to create. Click Save and Close
Final Graph with Textbox