Move Horizontal Axis to Bottom – Excel & Google Sheets
Written by
Reviewed by
Last updated on June 9, 2022
This tutorial will demonstrate how to move the Horizontal Axis (X Axis) to the bottom of the graph.
Move Horizontal Axis to Bottom in Excel
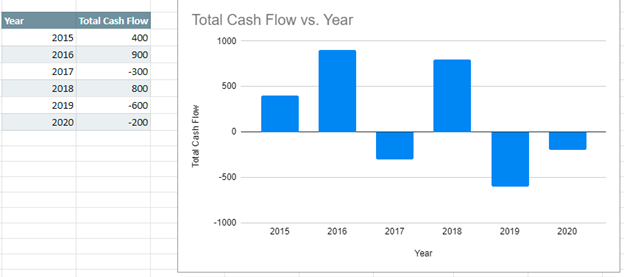
Starting with your Data
When working with data where the Y Axis has negative values in it, you’ll see that the X Axis automatically appears in the middle of the graph. This tutorial will show how to move it to the bottom of the graph so that it can be seen easier to see.

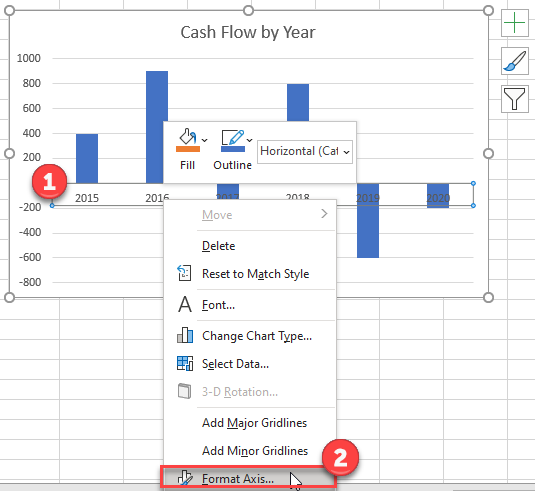
Moving X Axis to the Bottom of the Graph
- Click on the X Axis
- Select Format Axis
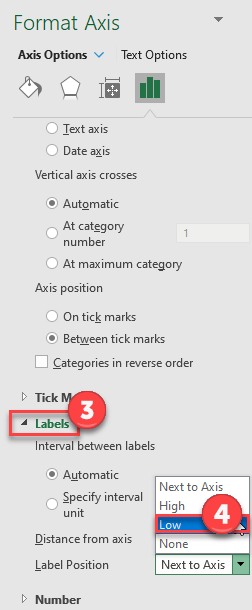
3. Under Format Axis, Select Labels
4. In the box next to Label Position, switch it to Low
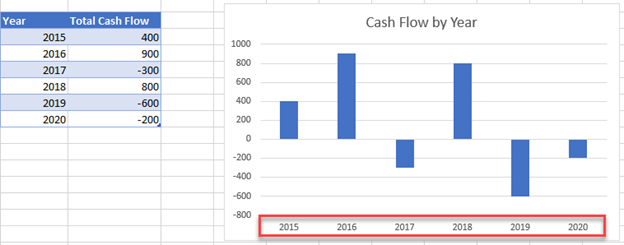
Final Graph in Excel
Now your X Axis Labels are showing at the bottom of the graph instead of in the middle, making it easier to see the labels.
Move Horizontal Axis to Bottom in Google Sheets
Unlike Excel, Google Sheets will automatically put the X Axis values at the bottom of the sheet. Your graph should automatically look like the one below.