Calculate & Plot Residuals – Excel & Google Sheets
Written by
Reviewed by
This tutorial will demonstrate how to calculate and plot residuals in Excel and Google Sheets.
Calculate & Plot Residuals – Excel
Starting with your Data
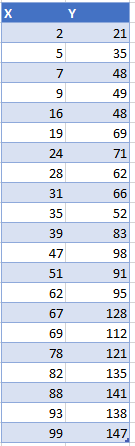
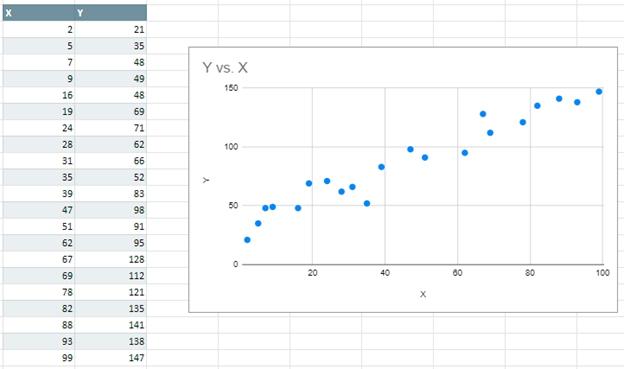
We’ll start with this dataset containing values for the X and Y Axis.
Creating a Scatterplot
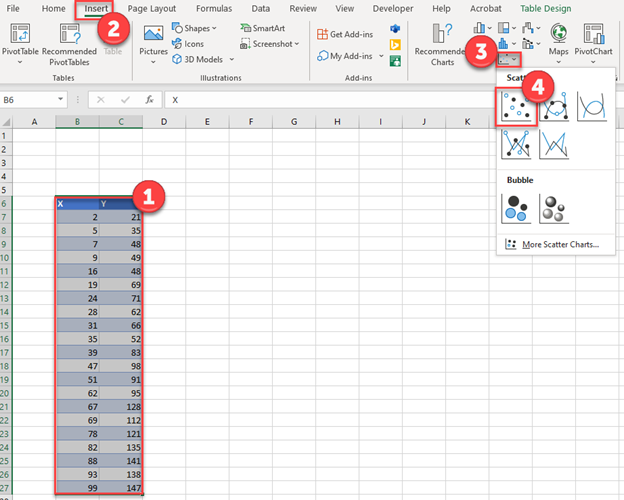
- Select your Data
- Click Insert
- Select Scatterplot
- Select the first Scatterplot
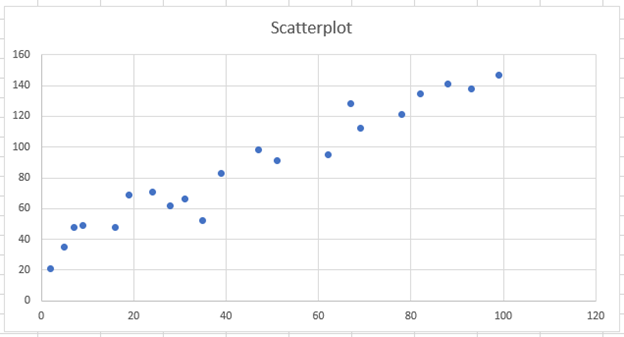
The Scatterplot should look similar to the one below.
Trendline
- Select + Sign in top right of the graph
- Select the Arrow next to Trendline
- Click More Options
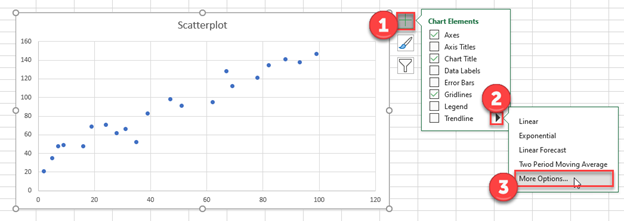
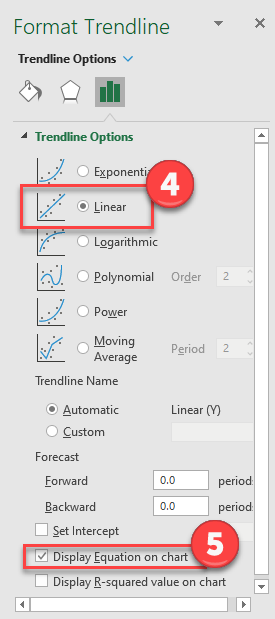
4. Select Linear Trendline
5. Check Display Equation on Chart
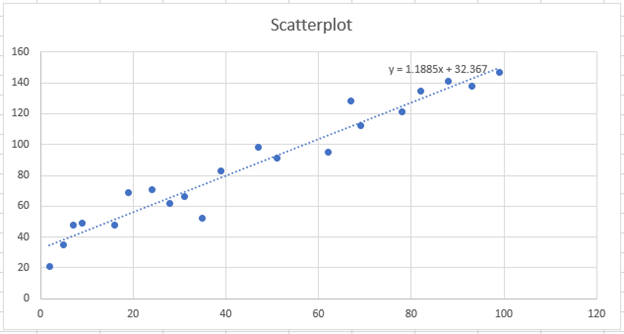
The trendline looks similar to the one below, that also shows the equation.
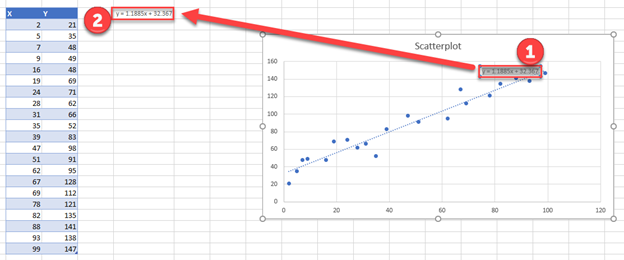
Copy and Paste Equation
- Highlight the equation and copy (CTRL + C)
- Paste the equation on the worksheet (CTRL + V)
Calculate Values
Using the equation from the previous step, create a formula: replacing x with the X Value in the table. Drag this formula down for all of the values.
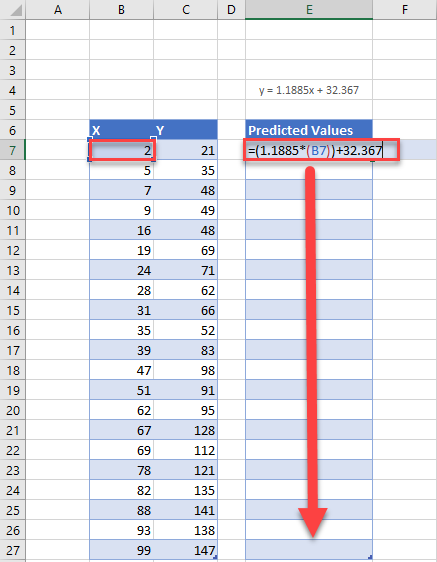
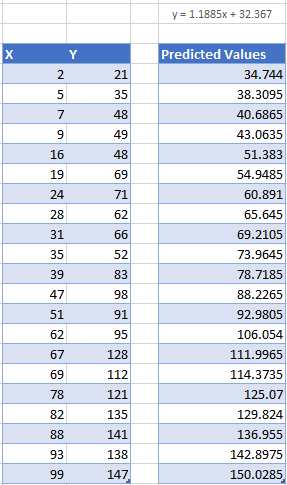
Table with Predicted Values
This formula calculates the predicted Y-axis values.
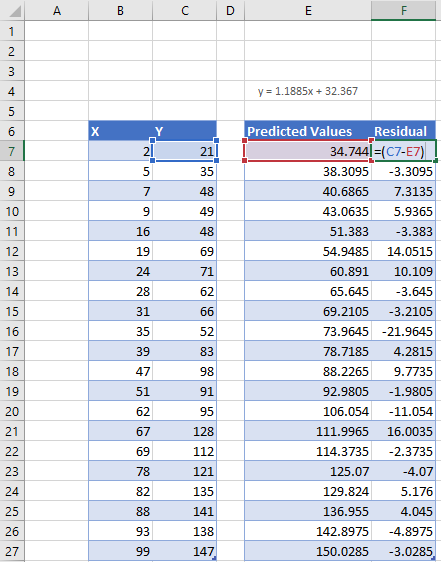
Find Residuals
Find the residuals by using the formula = Y Value – Predicted Values. Repeat this for all Values
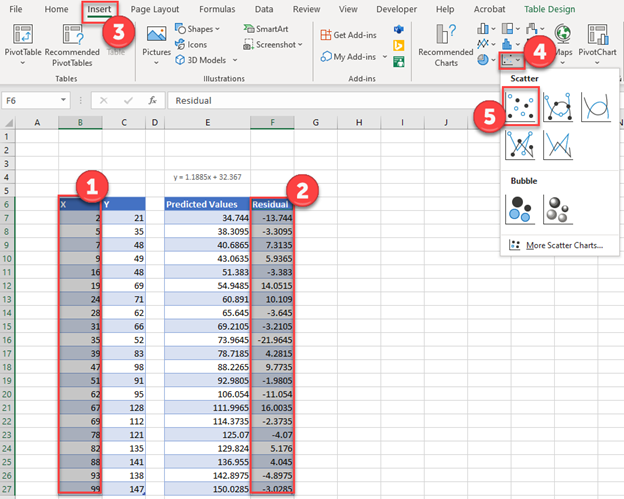
Creating Residual Plot
- Highlight the X Values
- Hold down CTRL and highlight Residuals
- Click Insert
- Select Scatter
- Click the first Scatterplot
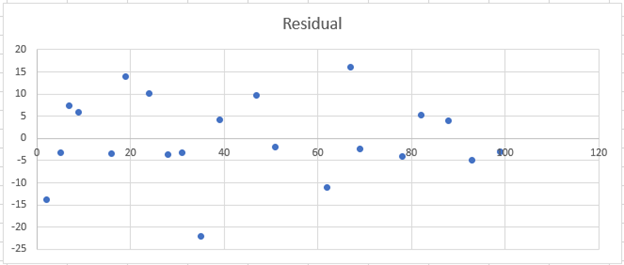
Final Residual Plot
This is the final residual plot
Calculate & Plot Residuals – Google Sheets
We’ll start with the Scatterplot below in Google Sheets
Creating a Trendline
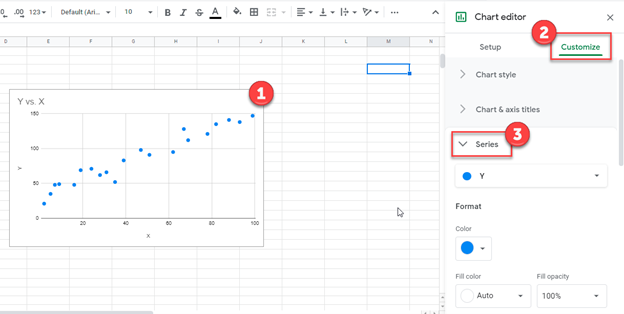
- Double Click Graph
- Select Customize in Chart Editor
- Click Series
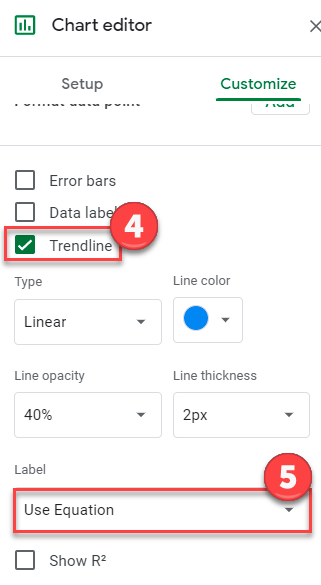
4. Check Trendline
5. Select Use Equation under Label
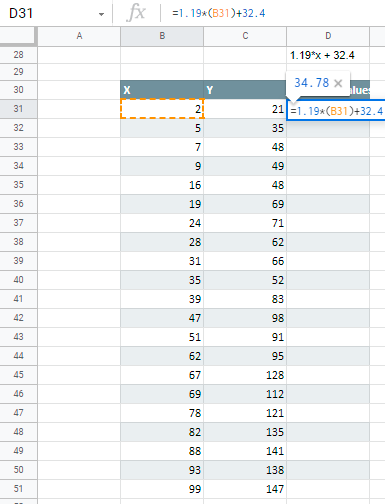
Predicted Values
Similar to the Excel example above, plug in the X Value in the equation that was given as shown below. Do this for all of the Values. This gives us the predicted Y-Axis values.
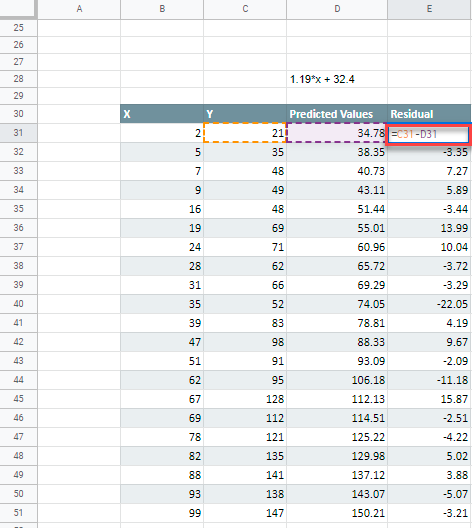
Residual Values
Similar to Excel, you’ll repeat the same formula where =Y Value – Predicted Value
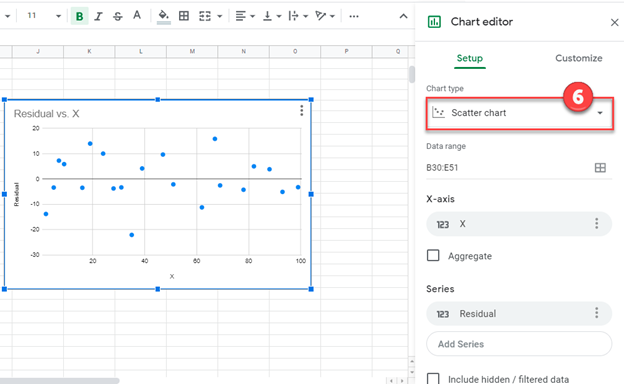
Creating Residual Plot
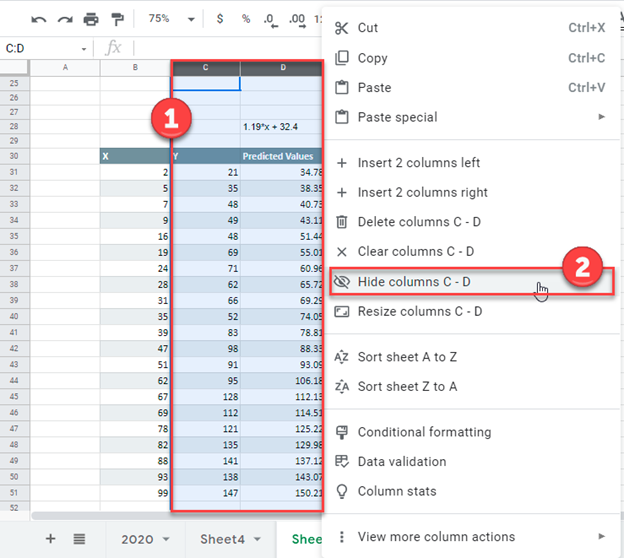
- Highlight Y Value and Predicted Values and Right Click
- Select Hide Column C-D
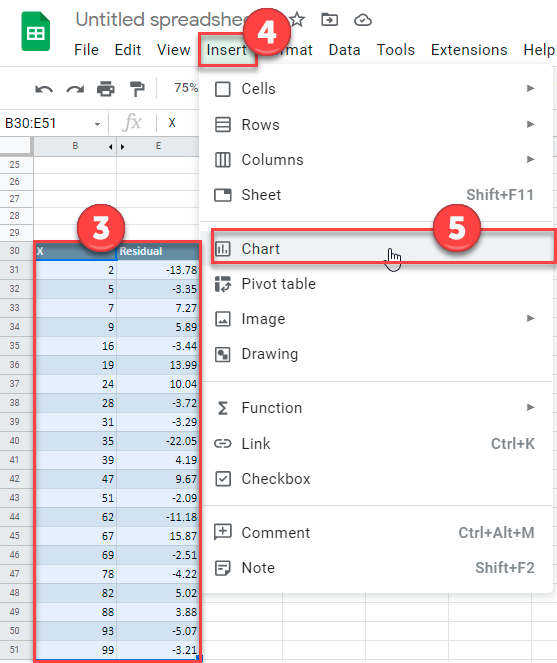
3. Highlight X and Residual Values
4. Select Insert
5. Click Chart
6. Change Chart Type to Scatter Chart