Rotate a Chart in Excel & Google Sheets
Written by
Reviewed by
Last updated on October 30, 2023
Rotate a Chart in Excel
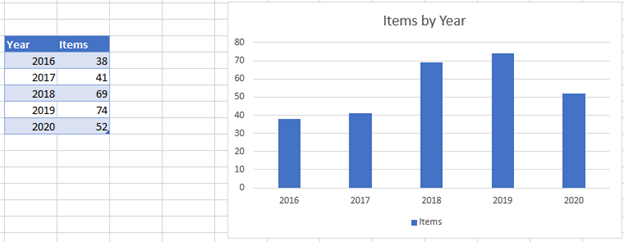
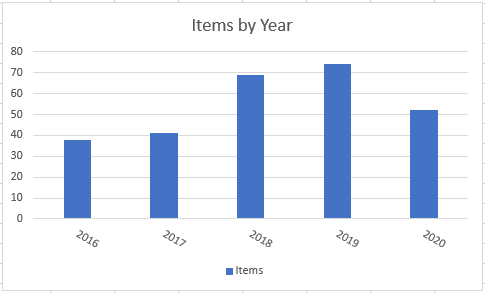
We’ll start with the below bar graph that shows the Items sold by Year.
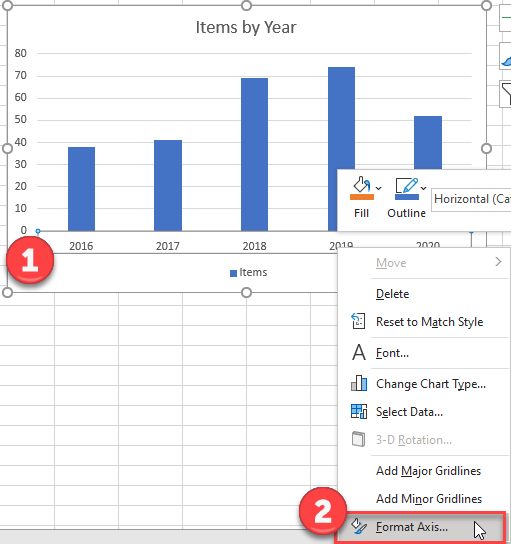
- Right click on X Axis
- Select Format Axis
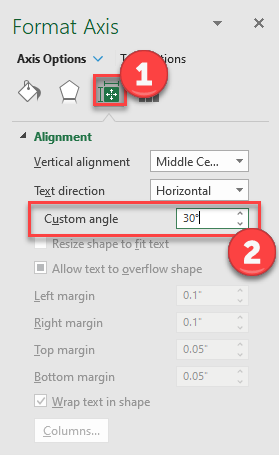
Change Angle of Label
- Click on the Size and Properties Tab
- Type in your Custom Angle. In this case, we’ll say 30°
And you’ll see the chart with rotated axis:
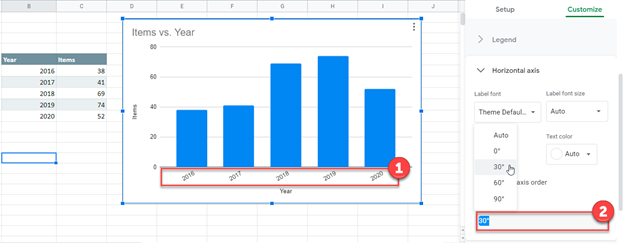
Rotate a Chart in Google Sheets
- Double Click on X Axis
- Under Slant Options, select which angle you would like to show the slant of the Axis