How to Change Chart Series Name – Excel & Google Sheets
Written by
Reviewed by
This tutorial will demonstrate how to change Series Names in Excel and Google Sheets.
Change Chart Series Name in Excel
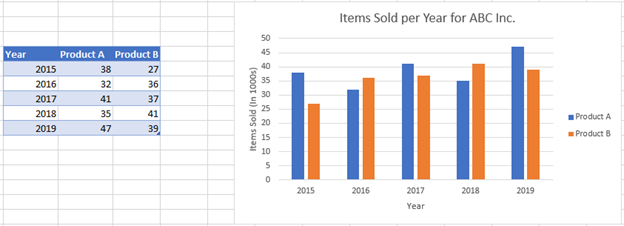
Start with your Graph
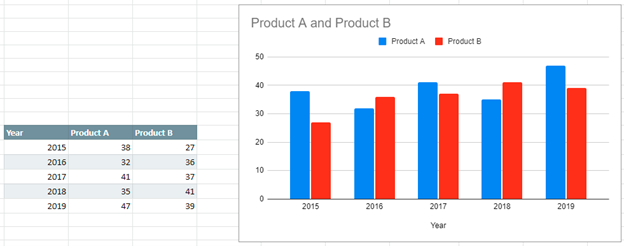
In this tutorial, we’ll show a Bar Graph comparing items sold for two different products by month. Let’s say instead of showing Product A and Product B on the graph, you want to show the actual series on the graph.
Changing Series Name
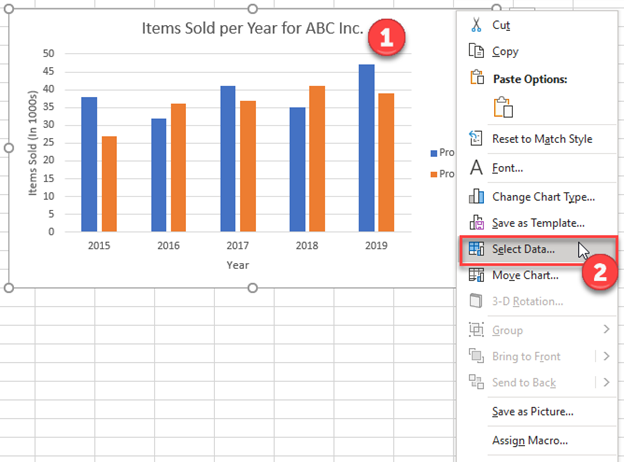
- Right click on the graph
- Click Select Data
Note: You will see the Series (Product A and Product B), which correlate to the legend on the graph.
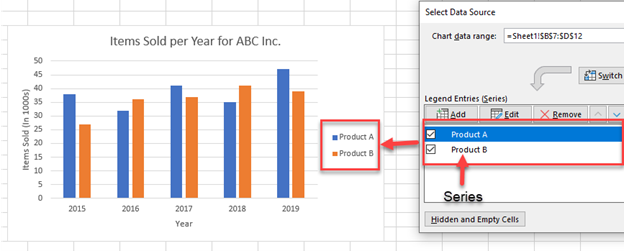
3. For each Series, Click Edit
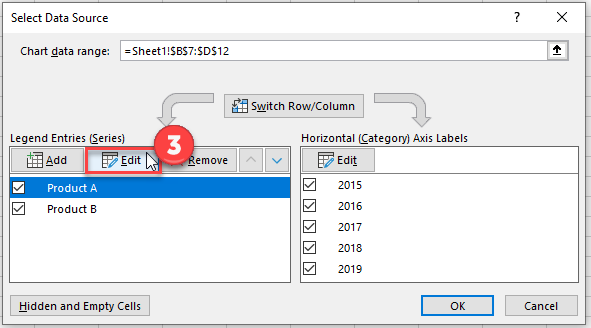
Note: You can see right now it is linked to a current cell. Right now, it is linked to “Product A”
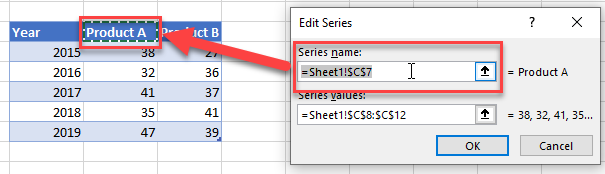
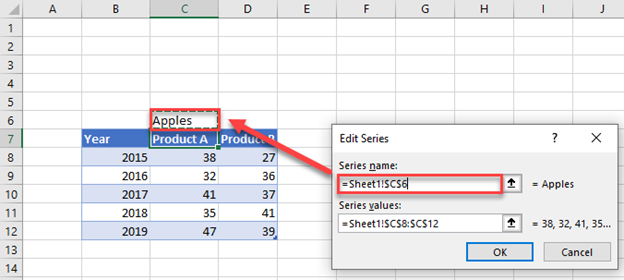
4. You can change this formula and link it to another cell
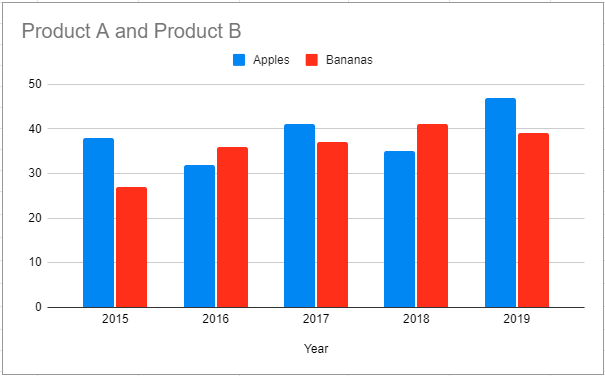
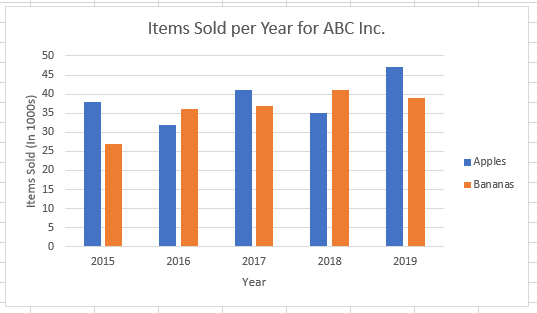
Final Graph with Series Name Change
After changing both Series Names, the final graph should look like this.
Change Chart Series Name in Google Sheets
Similar to Excel, you can see the graph with the generic series names on the graph and a table
- To Change, Double Click on the Legend Name and make your changes for both
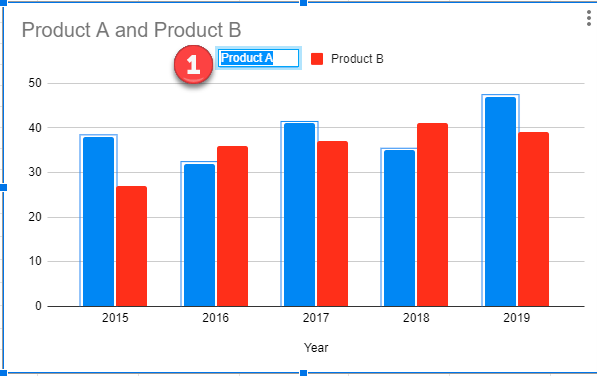
Final Graph with Changes
As you can see, the final graph shows the updates with the new series names.