How to Switch (Flip) X & Y Axis in Excel & Google Sheets
Written by
Reviewed by
This tutorial will demonstrate how to flip the X and Y Axis in Excel & Google Sheets charts.
How to Switch (Flip) X and Y Axis in Excel
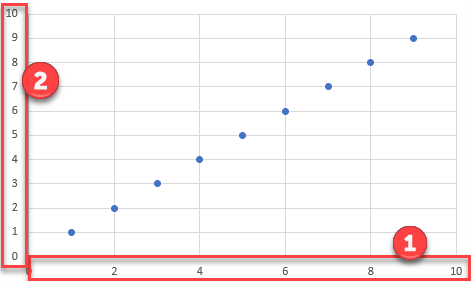
X & Y Axis Explanation
- X Axis – horizontal line of the graph. Recommended dependent variable
- Y Axis – vertical line of the graph; Recommended independent variable
Starting with Your Base Graph
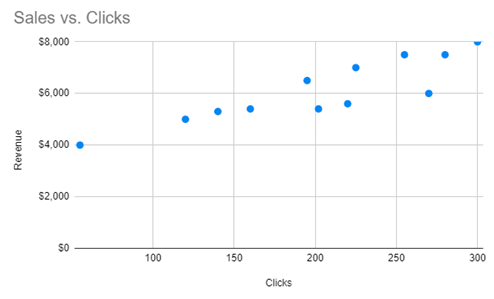
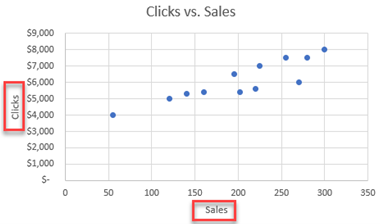
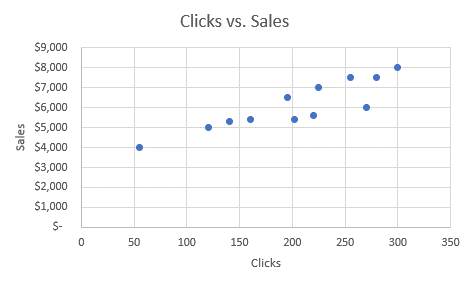
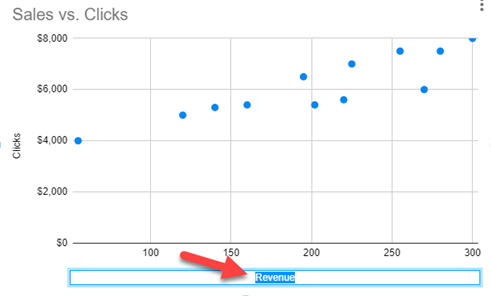
In this explanation, we’re going to use a scatterplot as the example to switch the X and Y axes. This scatterplot below shows the how the clicks and sales are related. Let’s say we want to change this graph so that the Sales will be on the Y Axis and Clicks on the X Axis.
Switching your X and Y Axis
- Right Click on Your Graph > Select Data

2. Click on Edit
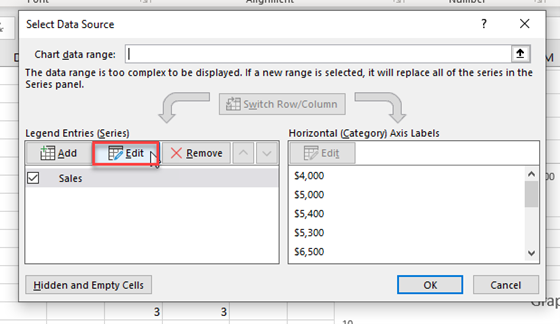
3. Switch the X and Y Axis
You’ll see the below table showing the current Series for the X Values and current Series for the Y Values.
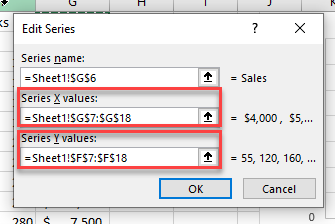
You want to swap these values. The formula for “Series X Values” should be in the “Services Y Values” and vice versa as seen below. Then click OK. In order to swap, use:
Ctrl + C to Copy
Ctrl + V to paste
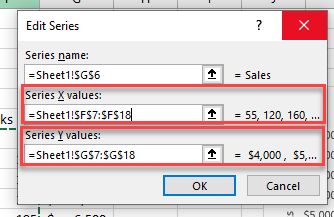
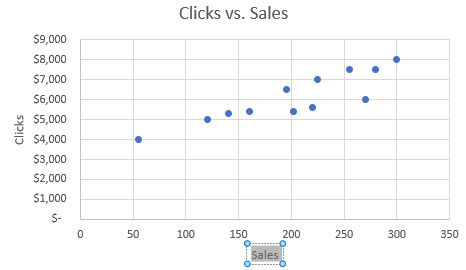
After clicking OK, you’ll see that the values of the X and Y Axis has swapped as requested. However, as you can see, we still must switch the Axis Title Names as these have not updated.
4. Updating Axis Titles
Double click on the Axis Title and change the name to the appropriate title that represents the values on that axis.
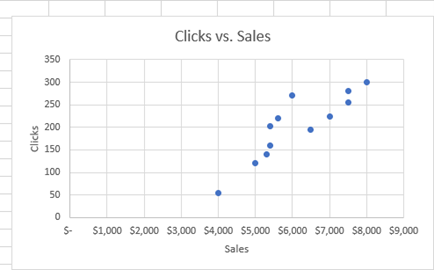
Final Graph after Swap
The final result shows the visualization in a more pleasing way where Sales are on the Y axis and Clicks are on the X Axis.
How to Switch (Flip) X and Y Axis in Google Sheets
Switching X and Y Axis
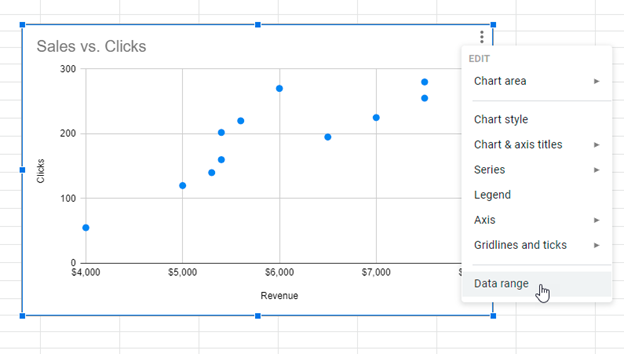
- Right Click on Graph > Select Data Range
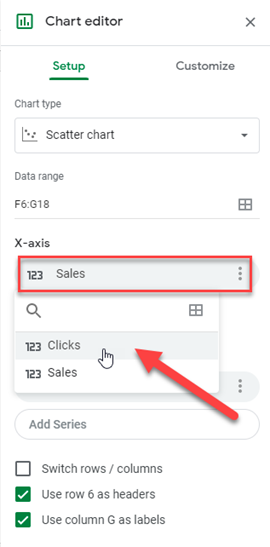
2. Click on Values under X-Axis and change. In this case, we’re switching the X-Axis “Clicks” to “Sales”.
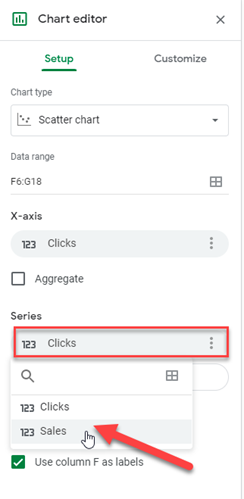
Do the same for the Y Axis where it says “Series”
Change Axis Titles
Similar to Excel, double-click the axis title to change the titles of the updated axes.
Final Graph after Swap
Finally, we have a finished product after swapping the x and y axis as shown below.