Binomial Distribution in Excel & Google Sheets
Written by
Reviewed by
This tutorial will demonstrate how to work with the Binomial Distribution in Excel and Google Sheets.

BINOMDIST Function Overview
The BINOMDIST function in Excel allows us to calculate two things:
- The probability of a certain number of binary outcomes occurring (ex. the probability of flipping a coin 10 times, and exactly 7 of the attempts landing as heads).
- The cumulative probability (ex. The probability that the coin lands on heads anywhere from 0-7 times).
What is the Binomial Distribution?
The binomial distribution encompasses the range of probabilities for any binary event that is repeated over time. For example, say you flip a fair coin 10 times. Certainly you “expect” there to be 5 heads to and 5 tails, but you may still end up with 7 heads and 3 tails. The binomial distribution allows us to measure the exact probabilities of these different events, as well as the overall distribution of likelihood for different combinations.
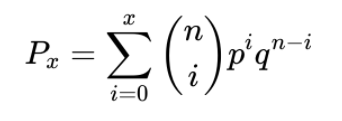
The probability of any individual number of successes within the Binomial Distribution (otherwise known as a Bernoulli Trial) reads as follows:
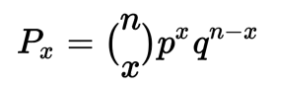
Where:
n = the number of trials
x = the number of “successes”
p = the probability of success for any individual trial
q = the probability of failure for any individual trial, also denoted as 1-p.
Binomial Distribution Example
In the example above, where you’re finding the probability of landing 7 out of 10 heads on a fair coin, you can plug in the following values:
n = 10
x = 7
p = 0.5
q = 0.5
After solving, you end up with a probability 0.1172 (11.72%) that exactly 7 of the 10 flips land on heads.
Binomial Distribution Excel Examples
To find the individual and cumulative probabilities in Excel, we will use the BINOMDIST Function in Excel. Using the example above with 7 out of 10 coins coming up heads, the Excel formula would be:
=BINOMDIST(7, 10, 1/2, FALSE)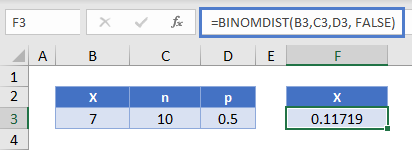
Where:
- The first argument (7) is x
- the second argument (10) is n
- The third argument (½) is p
- The fourth argument (FALSE), if TRUE, has Excel calculate the cumulative probability for all values less than or equal to x.
Binomial Distribution Table & Chart
Next let’s create a probability distribution table in Excel. The probability distribution calculates the probability of each number of occurrences.
=BINOMDIST(B10,10, 1/2, FALSE)
Reading this table: there is about a 12% probability of exactly 7 of 10 coins coming up heads.
We can create a chart from the Binomial Probability Distribution table above.
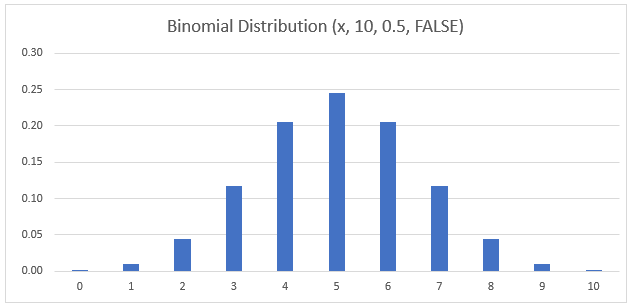
Binomial Distribution Chart
Notice that the binomial distribution for this experiment peaks at x=5. This is because the expected number of heads when flipping a fair coin 10 times is 5.
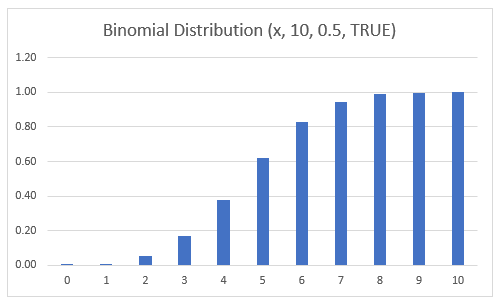
Binomial Cumulative Probability Distribution
Alternatively, you may choose to focus on the Cumulative Probability Distribution instead. This measures the probability of a number of success less than or equal to a certain number.
In graphical form, it looks like this:
To calculate the cumulative probability, you can simple sum up the individual probabilities calculated in the previous section.
Or you can use the BINOMDIST Function like so:
=BINOMDIST(B10, 10, 1/2, TRUE)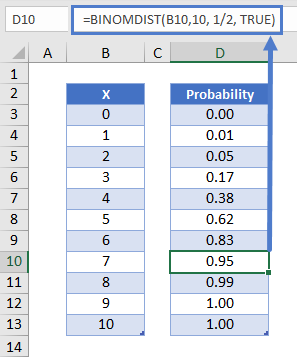
Notice that to calculate the cumulative probability we set the last argument to TRUE instead of FALSE.
Mathematically, this formula can be expressed as follows:
BINOM.DIST.RANGE – Find Probability of Range of Values
While BIMOMDIST serves as a way to find the probability of a single discrete point, the BINOM.DIST.RANGE function allows us to find the probability of achieving a certain range of successes.
Using the heads-or-tails example, we can find the probability that between 6 and 8 of our 10 attempts land as heads with the following formula.
=BINOM.DIST.RANGE(10, 0.5, 6, 8)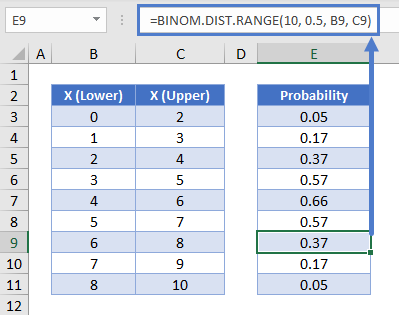
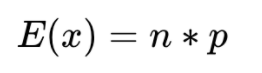
Binomial Expected Value – E(x)
For a binomial distribution of n number of Bernoulli trials, we can express the expected value for the number of successes:
This can be calculated in Excel like so:
=B5*B6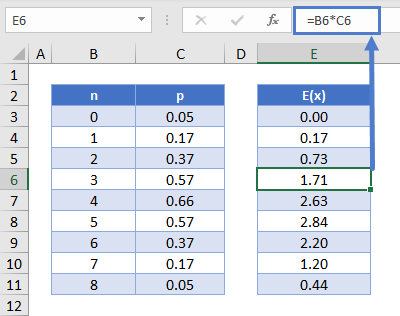
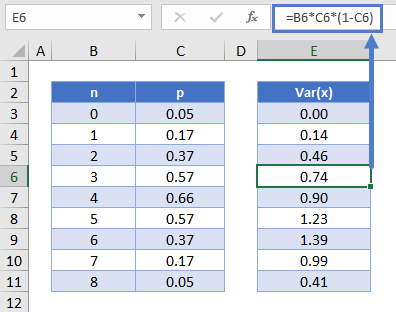
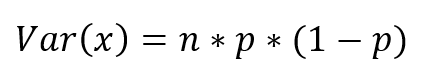
Binomial Variance – Var(x)
To calculate the variance of the distribution, use the formula:
This can be calculated in Excel like so:
=B6*C6*(1-C6)