How to Calculate Mean Squared Error (MSE) – Excel and Google Sheets
Written by
Reviewed by
The Mean Squared Error (MSE) is an estimate that measures the average squared difference between the estimated values and the actual values of a data distribution. In regression analysis, the MSE calculates the average squared differences between the points and the regression line. That is, the mean of the squares of the residuals.
The MSE is always positive, and decreases as the error in the forecasts decrease. That is, the closer the predicted values are to the actual values, the smaller the MSE.
The MSE of a set of observations is calculated using the formula:
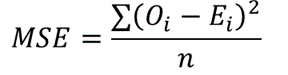
where Oi are the observed values;
Ei are the observed values;
∑ is a Greek letter called sigma which represents ‘sum’; and
n is the sample size (the number of observations).
How to Calculate the Mean Squared Error in Excel
Example
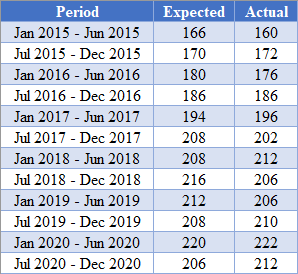
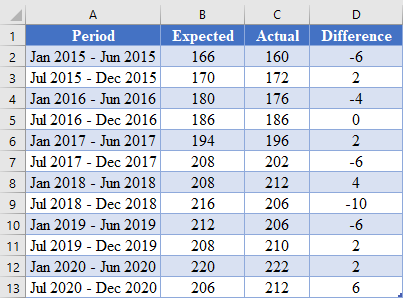
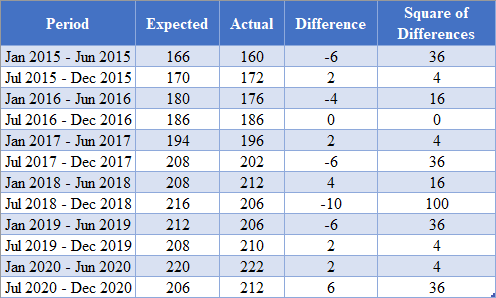
Background: The table below shows the biannual expected and the actual spending, in thousands of dollars, on residential and non-residential building construction for a certain state in the United States from January 2015 to July 2020.
Using the data in the table, calculate the mean squared error (MSE) of the actual data from the forecasted data.
Using the SUMSQ Function
First, obtain the difference between the predicted values and the actual values as shown in the picture below.
=C2-B2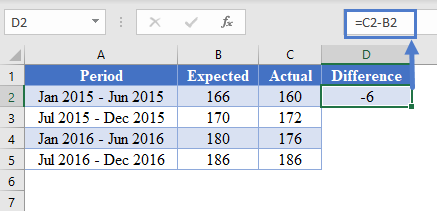
Complete the rest of the column as shown in the picture below.
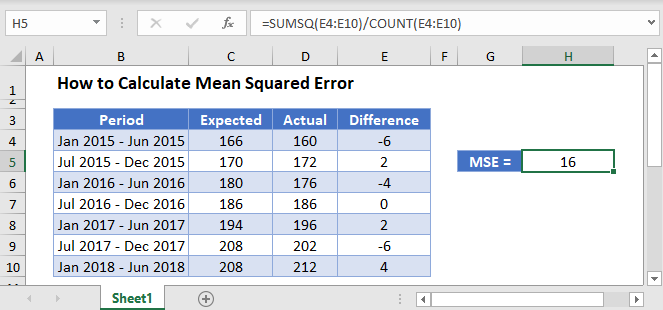
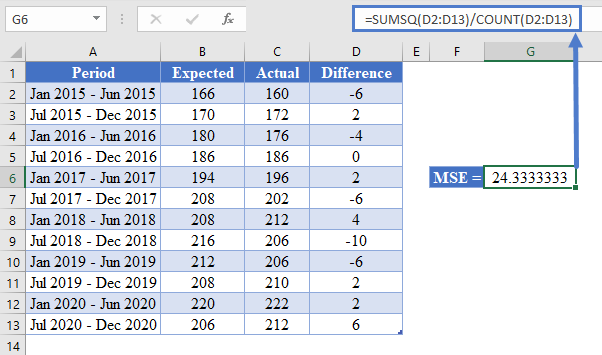
Next, calculate the MSE using the SUMSQ Function as shown in the picture below.
Using the AVERAGE Function
Another method you can use to obtain the MSE of a dataset is using the AVERAGE function. This method is described below.
First, perform the steps described in the method illustrated in the SUMSQ Function method above to obtain the difference between the predicted values and the actual values as shown in the picture below.
=C2-B2
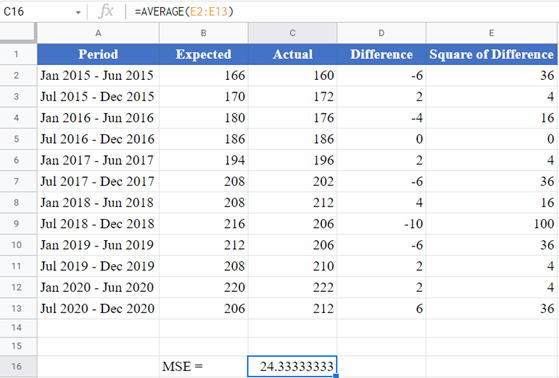
Next, calculate the square of the differences between the actual and the predicted values as shown in the picture below.
=D2^2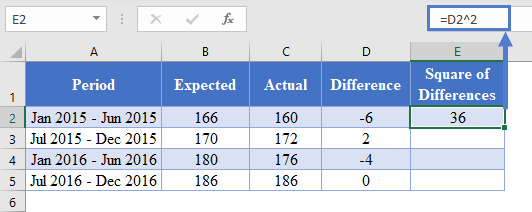
Complete the rest of the columns as shown in the picture below.
Next, calculate the MSE by taking the average of the Square of Differences column as shown in the picture below.
=AVERAGE(E2:E13)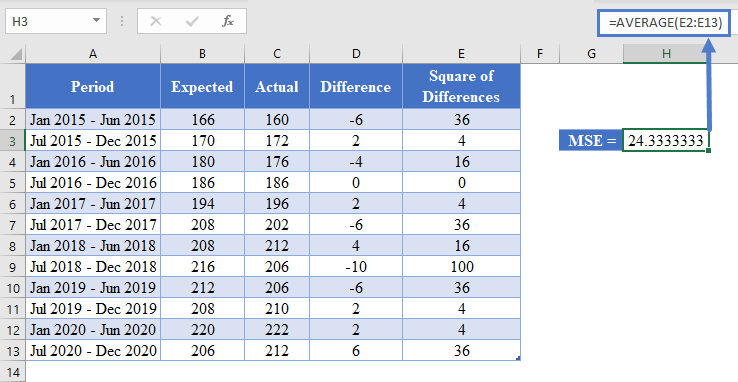
Using the MSE Formula
Another method you can use to obtain the MSE of a dataset is using the MSE formula. This is done by taking the sum of the Square of Differences and dividing the result by the count (sample size) as shown in the picture below.
=SUM(E2:E13)/COUNT(E2:E13)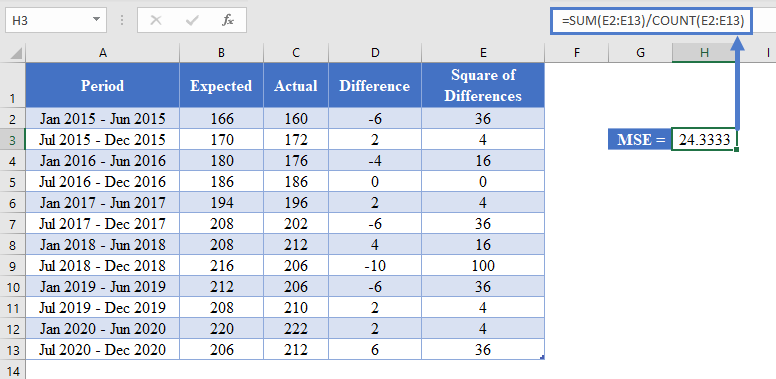
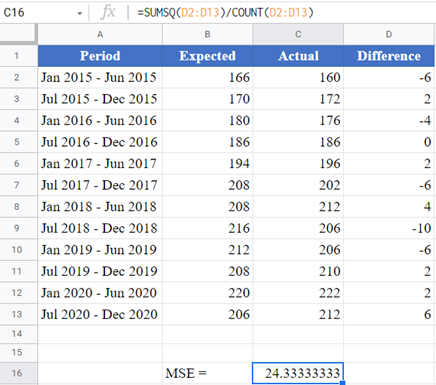
Mean Squared Error in Google Sheets
The Mean Squared Error (MSE) can be calculated in Google Sheets in the exact same way as it is calculated in Excel as shown in the pictures below.
Using the SUMSQ Function
Using the AVERAGE Function