Chi-Square P-Value – Excel and Google Sheets
Written by
Reviewed by
Chi-Square ( ![]() ) test is a statistical test used to determine whether observed data from a sample matches the
) test is a statistical test used to determine whether observed data from a sample matches the
theoretical (expected) data from the population, or whether there is a relationship (association) between two variables.
The Chi-Square p-value is the probability of obtaining a Chi-Square as larger or larger than the observed Chi-Square. The Chi-Square p-value is a positive number between 0 and 1, inclusive. It can also be expressed as a percentage.
When you perform a Chi-Square Test of Independence of Goodness of Fit Test, you obtain a test statistic, called Chi-Square observed ,
![]()
as a result. You can then use the observed Chi-Square to calculate a corresponding p-value which you can use to determine whether the Chi-Square test is statistically significant or not.
How to Find Chi-Square P-Value in Excel
To obtain the Chi-Square critical value in Excel, you use the CHISQ.DIST.RT Function.
CHISQ.DIST.RT Function
The CHISQ.DIST.RT Function returns the right-tailed probability (the p-value) of the chi-square distribution, which is used to make a conclusion whether a Chi-Square test is statistically significant or not.
If the p-value is less than the significant value, it means that the Chi-Square test is statistically significant, and the null hypothesis is rejected. That is, the sample data does not match the expected data from the population for a goodness of fit test or there is an association/relationship between the variables in the dataset for a test of independence.
CHISQ.DIST.RT Function Syntax
=CHISQ.DIST.RT(x, degree of freedom)- x: the x value for the CHISQ.DIST.RT Function is the test statistic. That is, the observed Chi-Square from the samples used for the experiment.
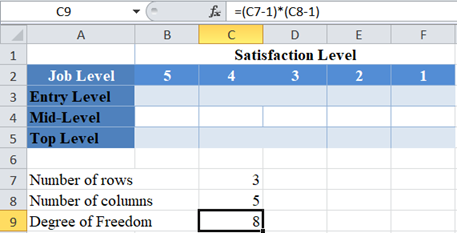
- The degree of freedom is calculated depending on the type of Chi-Square test being conducted. For the Chi-Square goodness of fit test, the degree of freedom is given by the number of observations, k , minus 1 (k-1). For the Chi-Square test of independence presented in a contingency (two-way) table, the degree of freedom is given by the number of rows, r , minus 1 times the number of columns, c , minus 1; (r-1)(c-1).
How to Use CHISQ.DIST.RT Function – Test of Independence
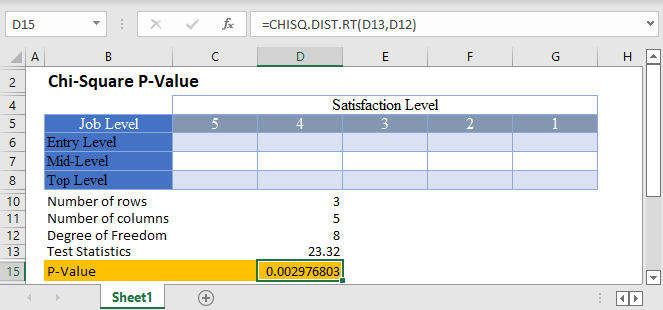
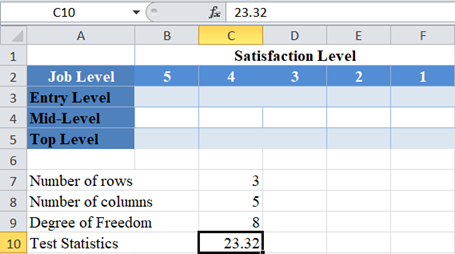
Background: A statistician wants to investigate the relationship between job levels and job satisfaction for employees in a certain industry in the United States. He grouped employees into three categories; entry-level, mid-level, and top-level employees. A sample of employees from each category were asked to rate how satisfied they are with their current job roles based on a 5-point rating scale, 1 to 5, where 5 signifies very satisfied. After analyzing his result and conducting a Chi-Square test, he observed a Chi-Square value of 23.32 . Calculate the p-value for this test, and hence determine at a 5% significant level whether there is a relationship between job levels and job satisfaction for employees in the industry.
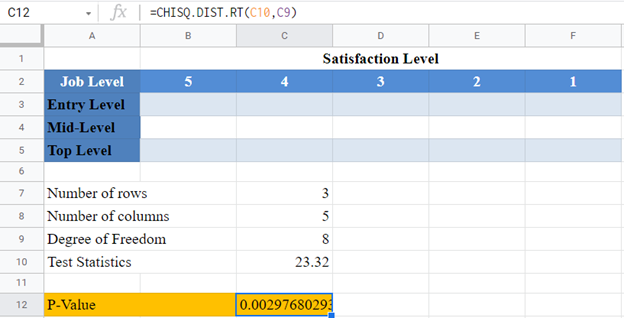
First, identify the number of rows and the number of columns. We visualize the arrangement of the result of the investigation in the following Excel table:
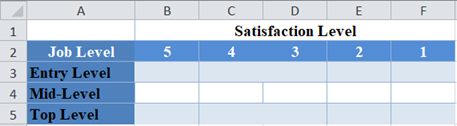
From the above table, you can see that we have three rows (entry-level, mid-level, and top-level), and five columns (5, 4, 3, 2, and 1).
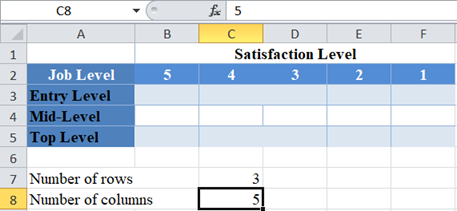
Next, calculate the degree of freedom.
Finally, calculate the required p-value using the CHISQ.DIST.RT Function and also using the test statistics given in the question.
And the p-value is:
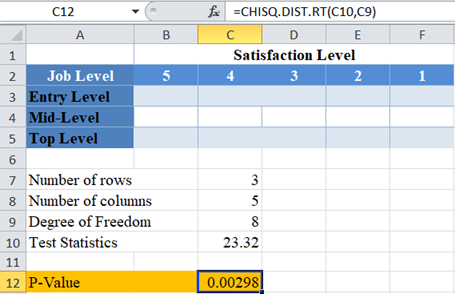
Here, the p-value is 0.00298 which is less than the significance level of 0.05 . Hence, the Chi-Square test is significant, and you “reject the null hypothesis”. That is, there is statistically significant evidence that there is a relationship between job levels and job satisfaction for employees in the industry.
How to Use CHISQ.DIST.RT Function – Goodness of Fit Test
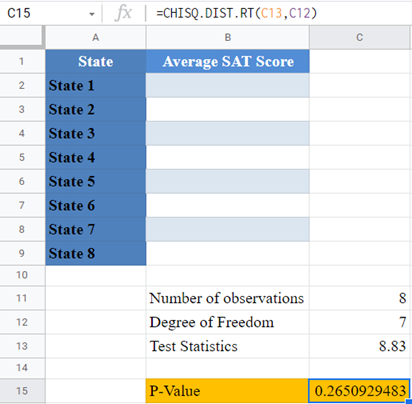
Background: For the past five years, the average SAT test scores of candidates taking SAT from certain eight states has been approximately equal. A statistician wants to investigate whether the average test scores from these eight states in this year’s SAT follow the same pattern as the past five years. He conducts a Chi-Square test of the average test scores from this year’s SAT against the expected average test scores based on the last five years’ pattern and observed a Chi-Square value of 8.83 . Calculate the p-value for this test, and hence determine at a 5% significant level whether the average test scores in this year’s SAT follow the same pattern as in the past five years for these eight states.
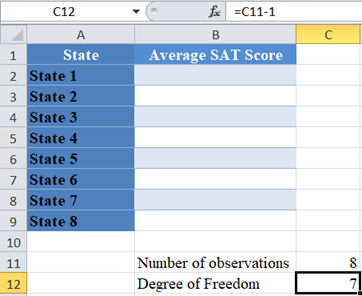
First, identify the number of observations. We visualize the data in the following Excel table:
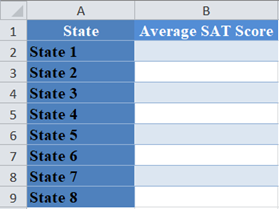
From the above table, you can see that there are eight observations (average test scores from eight states).
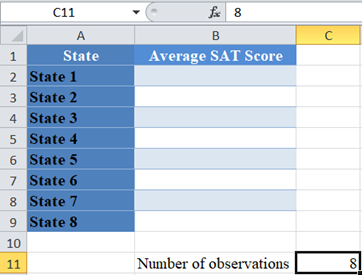
Next, calculate the degree of freedom. Recall that the degree of freedom for the Chi-Square goodness of fit test is given by the number of observations minus 1.
Finally, calculate the required p-value using the CHISQ.DIST.RT Function and also using the test statistics given in the question.
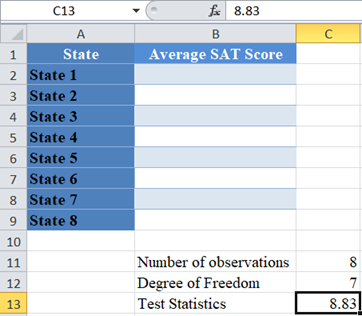
And the p-value is:
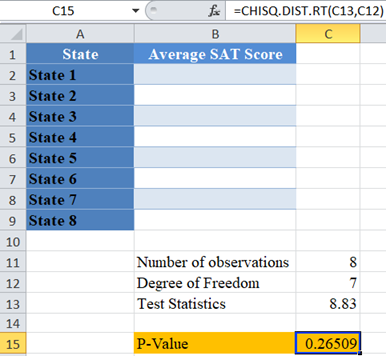
Here, the p-value is 0.26509 which is greater than the significance level of 0.05 . Hence, the Chi-Square test is not significant, and you “fail to reject the null hypothesis”. That is, there is not enough statistically significant evidence to suggest that the average test scores in this year’s SAT do not follow the same pattern as in the past eight years for these eight states.
How to Find Chi-Square P-Value in Google Sheets
The Chi-Square p-value can be calculated using a similar method in Google Sheets.
You can use the CHISQ.DIST.RT Function the same way as in Excel.
The Chi-Square test of independence p-value in Google Sheets is as follows:
And the Chi-Square goodness of fit test p-value in Google Sheets is as follows:
Common Errors –CHISQ.DIST.RT Function
Some of the errors you may encounter when using the CHISQ.DIST.RT Function.
- DIST.RT Function returns #VALUE! error value when either x or the degree of freedom argument is not a number.
- DIST.RT Function returns #NUM error value when the degree of freedom is less than 1 or greater than

- DIST.RT Function expects the degree of freedom argument to be an integer, when not an integer, the function returns the value for the integer part. That is, CHISQ.DIST.RT Function will return the same value for the degrees of freedom values of 3, 3.2, 3.8, etc.
