Naïve Forecast – Excel and Google Sheets
This tutorial will demonstrate how to calculate the Naïve forecast in Excel and Google Sheets.
Overview
Naïve Forecast
Naïve Forecasting is a forecasting technique in which the forecast for the current period is set to the actual value from the previous period. That is, suppose the monthly revenue of a company for the month of May is $9,415, using the naïve forecasting technique, the company will forecast that the monthly revenue for the month of June will as well be $9,415.
The naïve forecasting technique is useful because it is easy to calculate, and it helps an organization to keep track and make sure that they are either improving or maintaining current levels of productivity.
The naïve forecasting technique considers only historical data in making forecasts and does not consider variables like seasonality, external factors, etc. This may lead to a high degree of variability between actual values and forecasted values. This makes this method of forecasting not to be a reliable method of forecasting in real-world applications.
How to Forecast Using Naïve Forecasting in Excel
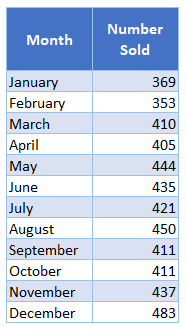
Background: The monthly sales of sneakers by company XYZ through its local store are shown in the table below.
Produce the naïve forecasts for the months’ data and calculate the forecast errors produced by the forecast using the mean absolute error, root mean square error, and mean absolute percentage error.
Also, produce the forecasts for the months’ data using the 3-months simple moving average and the 3-months exponential moving average techniques, calculate the forecast errors as in the naïve forecast, and compare the forecast errors produced by the three techniques.
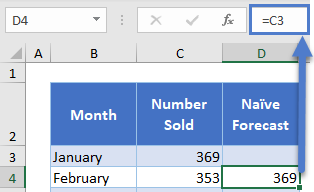
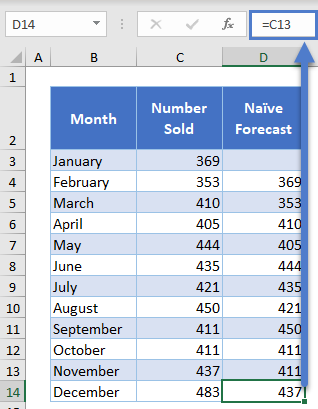
First, calculate the naïve forecasts by setting each forecast equal to the previous month’s sales.
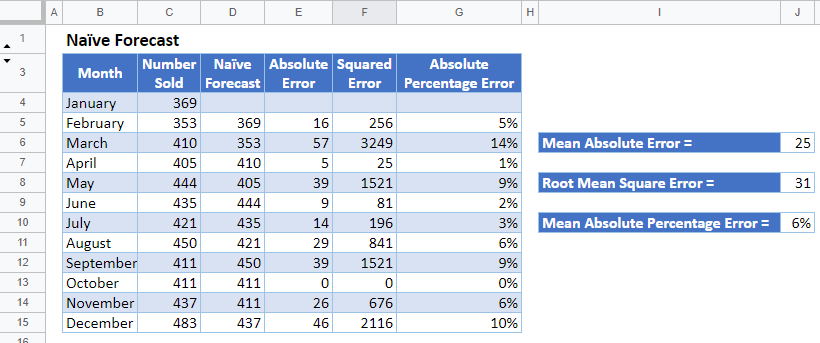
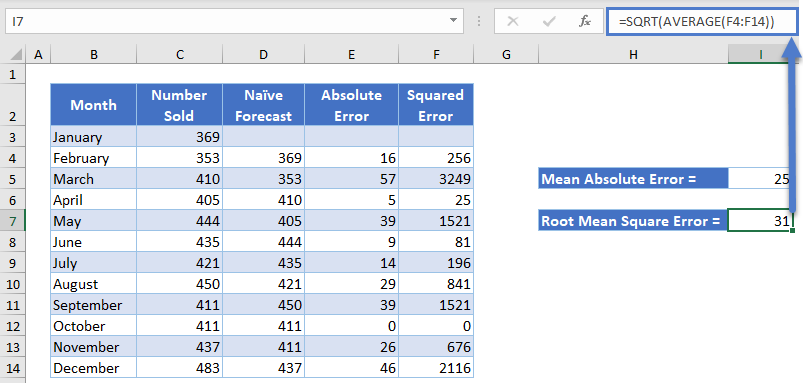
The complete Naïve Forecast column is shown below.
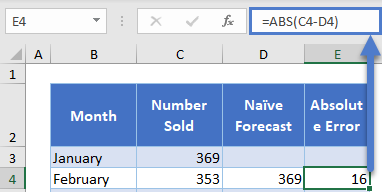
Next, calculate the mean absolute error of the naïve forecast from the actual sales by first calculating the absolute value of the difference between each naïve forecast and the actual sale.
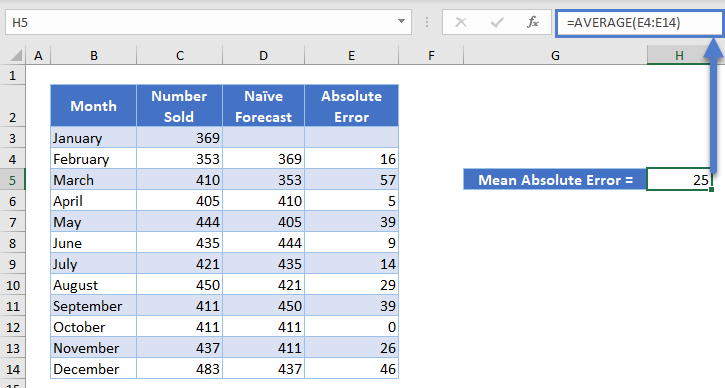
Autofill the rest of the column and then calculate their average to get the Mean Absolute Error.
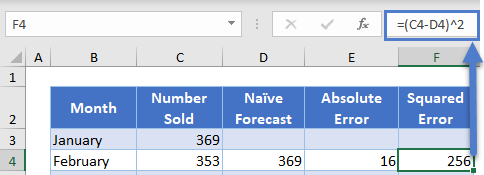
Next, calculate the root mean square error of the naïve forecast from the actual sales by first calculating the square of the difference between each naïve forecast and the actual sale.
Autofill the rest of the column and then calculate the square root of their average to get the Root Mean Square Error.
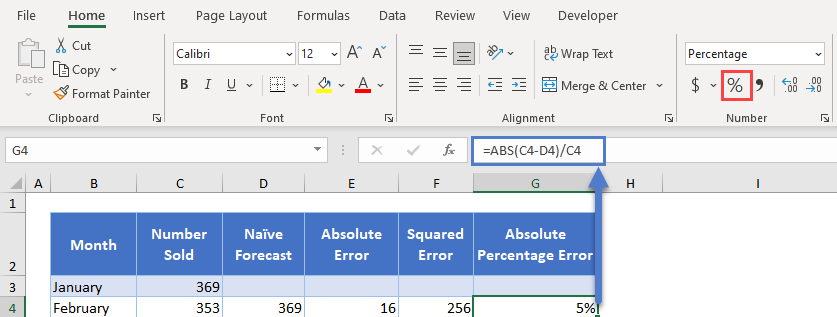
Next, calculate the absolute percentage error of the naïve forecast from the actual sales by first dividing the absolute value of the difference between each naïve forecast and the actual sale by the actual sale. Use the Percent Style button to convert the cells to percentages.
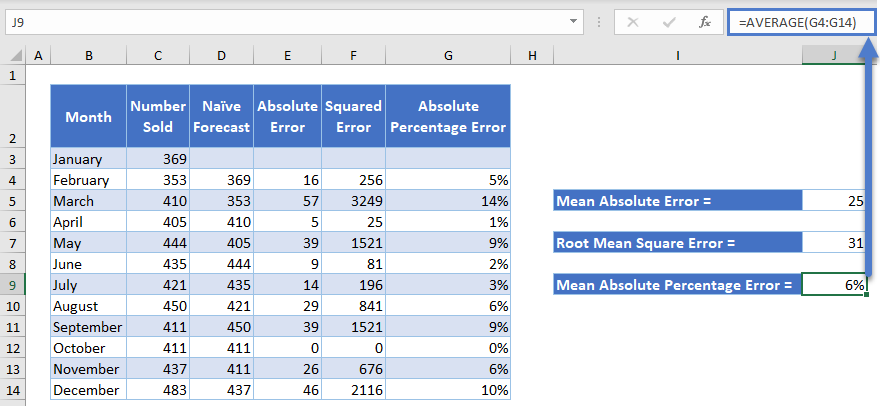
Autofil the rest of the column and then calculate their average to get the Mean Absolute Percentage Error.
Compare Naïve Forecasting Technique to Other Forecasting Techniques
Calculate the forecasts using the Simple Moving Average (SMA) forecasting technique and calculate the forecast errors as done for the naïve forecasts above.
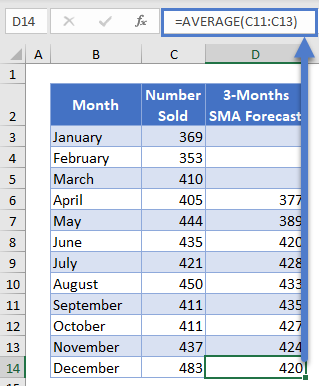
First, calculate the 3-months simple moving average forecasts by finding the average of 3 previous months’ sales of each sales data.
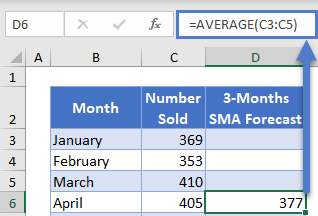
Complete the rest of the column and the complete 3-Months SMA Forecast column is as shown below.
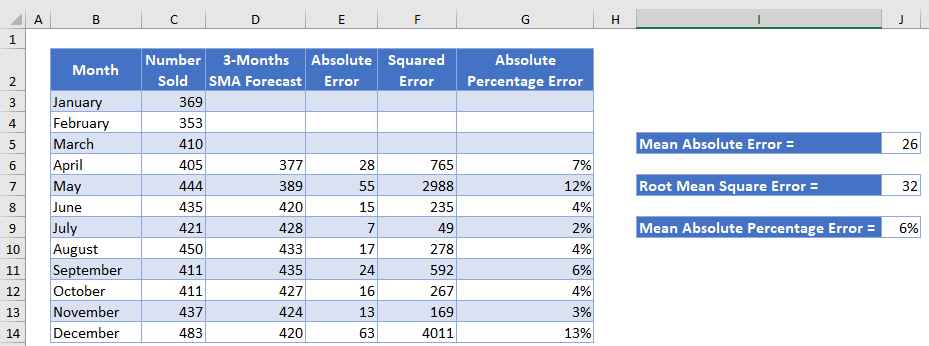
Next, follow the steps described above to calculate the Mean Absolute Error, Root Mean Square Error, and Mean Absolute Percentage Error.
Also, calculate the forecasts using the Exponential Moving Average (EMA) forecasting technique and calculate the forecast errors as done for the naïve forecasts above.
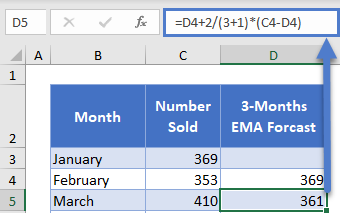
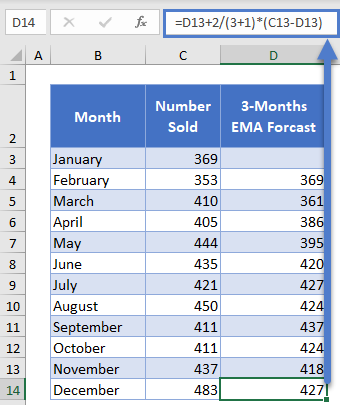
First, calculate the 3-months exponential moving average by setting the forecast for the second month to the actual sales value of the first month and use the formula below for the rest of the EMA values.
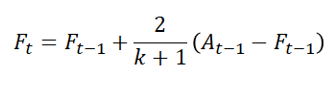
where At-1 is the actual value for the previous period;
Ft and Ft-1 are the current and the previous forecasts, respectively; and
![]() is the exponential smoothing factor with k as the desired number of sub-divisions of the dataset.
is the exponential smoothing factor with k as the desired number of sub-divisions of the dataset.
The second and the third months’ EMA Forecast are shown below.
Complete the rest of the column and the complete 3-Months EMA Forecast column as shown below.
Next, follow the steps described above to calculate the Mean Absolute Error, Root Mean Square Error, and Mean Absolute Percentage Error.
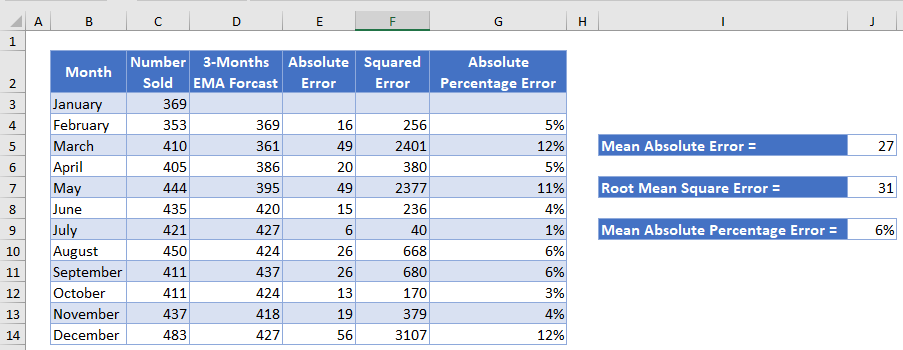
Because the sales’ values do not have spikes and dips caused by seasonality or other external factors, you can see that the forecast errors produced by the three forecasting techniques are similar. Thus, any of the three forecasting techniques is suitable for this dataset.
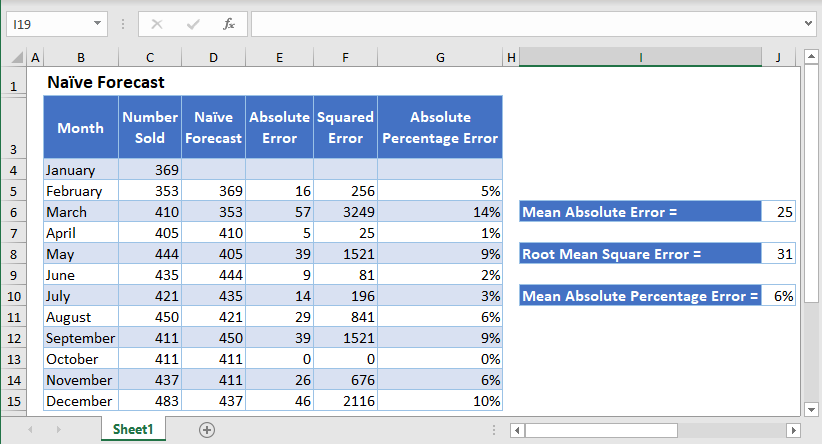
Naïve Forecast in Google Sheets
Naïve forecasts can be calculated in Google Sheets in a similar way as it is calculated in Excel as shown in the pictures below.