STDEV.P vs STDEV.S (Population vs Sample Standard Deviations) – Excel and Google Sheets
Written by
Reviewed by
This tutorial will discuss the differences between Population and Sample Standard Deviation and demonstrate how to use the STDEV.P and STDEV.S Functions in Excel and Google Sheets.
Standard deviation is a measure of the spread of a data distribution. It measures the average distance of each data point from the mean of the dataset.
In Excel, there are two functions used to calculate the standard deviation of a data set. The formula you use to calculate the standard deviation of a dataset depends on whether the dataset is considered the entire population under consideration or the data is a sample representing the population under consideration.
- The STDEV.P Function calculates the standard deviation of a dataset if the dataset is considered to be from a population.
- The STDEV.S Function calculates the standard deviation of a dataset if the dataset is considered to be from a sample.
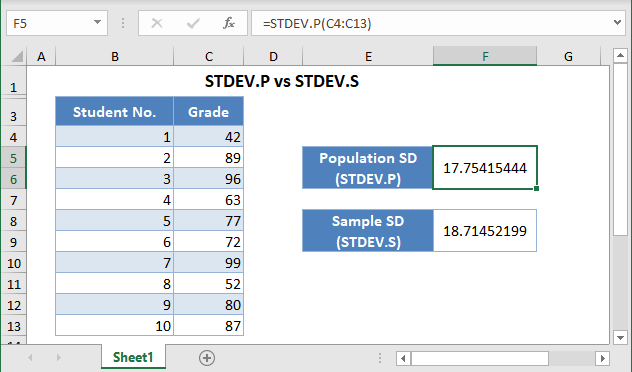
STDEV.P vs STDEV.S – The Difference
The STDEV.P Function is based on the formula:
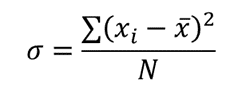
Where σ is the population standard deviation;
∑ is a Greek letter called sigma which represents ‘sum’;
![]() represents each data point;
represents each data point;
![]() is the mean (average) of the dataset; and
is the mean (average) of the dataset; and
N is the population size (the number of data points in the population).
The STDEV.S Function is based on the formula:
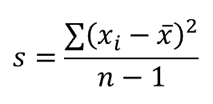
Where is the sample standard deviation;
∑ is a Greek letter called sigma which represents ‘sum’;
![]() represents each data point;
represents each data point;
![]() is the mean (average) of the dataset; and
is the mean (average) of the dataset; and
n is the sample size (the number of data points in the sample).
Since the divisor in the population standard deviation formula is N which is greater than the divisor for the sample standard deviation formula, n-1, the population standard deviation will always be smaller than the sample standard deviation when both are calculated using the same dataset.
When to Use STDEV.P vs STDEV.S Functions
Usually, we would want to calculate the standard deviation of all the data points in our population of interest. However, most times we are not able to have access to all the data points in the population. So, we select a subset of the population of interest which we refer to as the sample. With the sample, we then try to approximate the standard deviation of the population using the sample.
Use the STDEV.P Function when:
- Your dataset represents all the data points of the population of interest; or
- Your dataset represents the sample of a population, however, you do not wish to use your findings to generalize (estimate) the population.
Use the STDEV.S Function when your dataset represents the sample of a population and you wish to use your findings to generalize (estimate) the population. This is the case most of the time.
How to the STDEV.P and STDEV.S Functions in Excel
STDEV.P Function
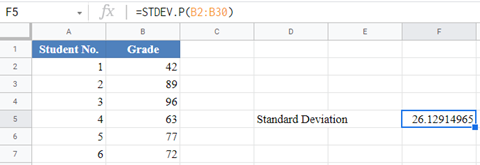
Background: Ms. Fatima teaches Statistics 101 at a local college. The table below shows the percentage grades of the 2021 Statistics 101 Fall semester students. Calculate the standard deviation of the percentage grades of Ms. Fatima’s 2021 Statistics 101 Fall semester students.
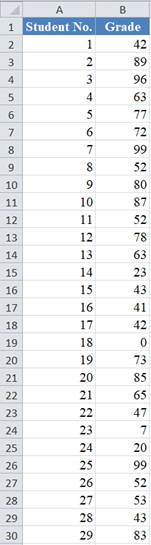
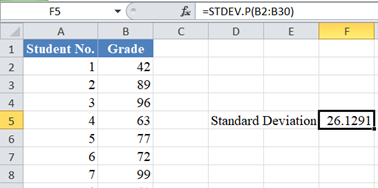
Here, we are interested in only Ms. Fatima’s 2021 Statistics 101 Fall semester students and the given dataset contains all the grades of Ms. Fatima’s 2021 Statistics 101 Fall semester students. So, the given dataset is treated as the population of interest. Thus, we use the STDEV.P Function to calculate the standard deviation as shown in the picture below.
STDEV.S Function
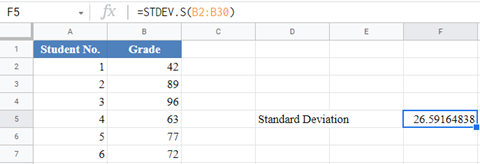
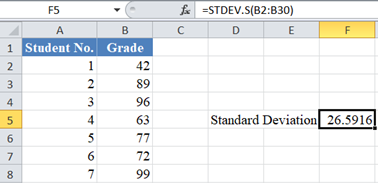
Background: Ms. Fatima teaches Statistics 101 at a local college. The table below shows the percentage grades of the 2021 Statistics 101 Fall semester students. Use the data to estimate the standard deviation of the percent grades of Ms. Fatima’s Statistics 101 students.

Here, we are interested in all of Ms. Fatima’s Statistics 101 students. However, we only have information about Ms. Fatima’s Statistics 101 2021 Fall semester students which is a subset of all Ms. Fatima’s Statistics 101 students. So, the given dataset is treated as a sample from the population of interest. Thus, we use the STDEV.S Function to calculate the standard deviation as shown in the picture below.
STDEV.P vs STDEV.S in Google Sheets
The STDEV.P and STDEV.S Functions are used in Google Sheets in the exact same way as they are used in Excel.