Tukey Test – Excel and Google Sheets
Written by
Reviewed by
Tukey test, also known as Tukey’s Honest Significant Test (HSD) test, is a post-hoc statistical test used to determine whether the means of two sets of data are statistically different from each other. This test is based on the studentized range distribution and is performed after an ANOVA test has indicated a significant difference in means of three or more sets of data.
Similarities/Differences between Student’s T-Test, ANOVA Test, and Tukey Test
- The Student’s T-Test is used to determine whether there is a statistically significant difference between TWO sets of data while the ANOVA and Tukey’s Tests are used to determine whether there is a statistically significant difference between MORE THAN TWO sets of data.
- The ANOVA test tells you that there is a difference, or not, in the means of three or more sets of data, but does not specify the pair(s) of data that causes the difference. Tukey’s HSD test specifies the pair(s) of data that causes the difference in means identified from an ANOVA Test.
Assumptions for Tukey Tests
- The samples are drawn independently of each other.
- The observations within each sample are drawn randomly and independently of each other.
- The data in each group are from a normally distributed population.
- The populations from which each group’s data were drawn have equal variances.
- The sample sizes of all the groups are equal. (If the groups have different sample sizes, a Tukey-Kramer Test is performed).
When to Perform Tukey Test
Tukey test is performed to find out the specific pair(s) of groups that cause the difference after an ANOVA Test had shown that there is a significant difference in the means of the groups tested, and the sample sizes of the groups are the same.
How to Perform a Tukey Test in Excel
q-Critical Values Table
The Tukey test compares the difference between each pair of means of the groups with an appropriate adjustment for the multiple testing, called the q critical value.
Example
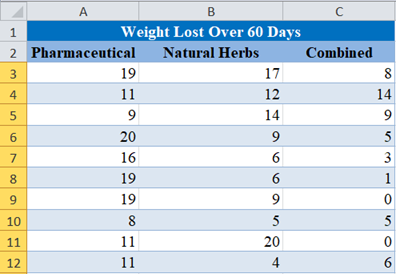
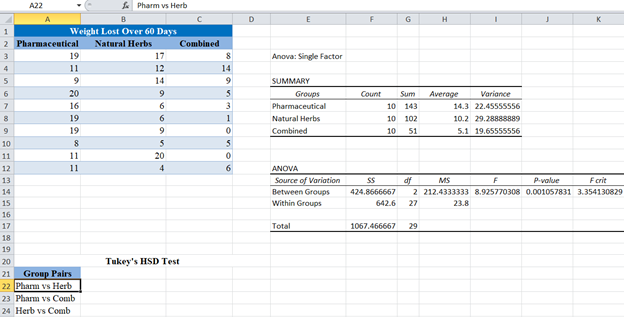
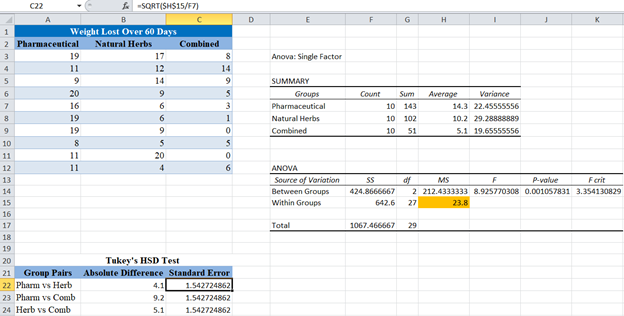
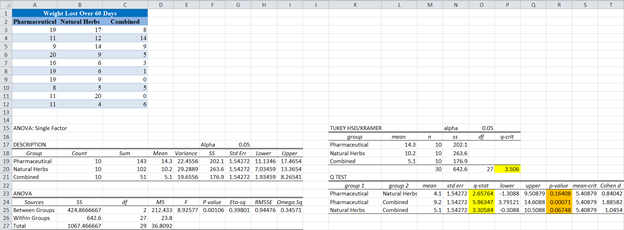
Background: A researcher wants to find out the effectiveness of three weight-loss therapies: pharmaceutical medicine approach, natural herbs approach, and combination of pharmaceutical medicine and natural herbs. He randomly selects 10 participants for each group and administers one therapy to each of the groups. He measured the weights of the participants before the therapy and after 60 days since the commencement of the therapy. The amount of weight lost, in pounds, for each of the participants in the groups is presented in the table below. Test at a 5% significant level whether there is a significant difference in the amount of weight lost for each pair of therapies.
For the purpose of this test, we assume that the populations from which these samples were drawn have equal variances (or you can test for equal variances using Bartlett’s Test)
First, perform an ANOVA Test on the data as follows:
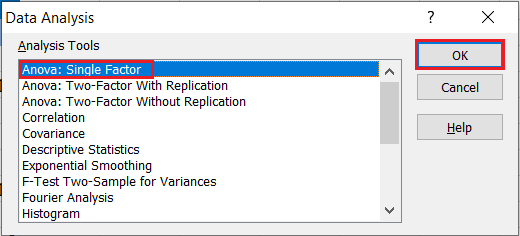
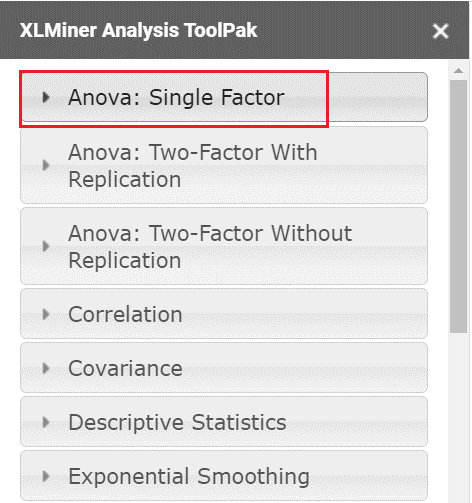
Use the “Anova: Single Factor” feature located in the Data Ribbon > Data Analysis.

If you don’t see the Data Analysis option, you will need to install the Data Analysis Toolpak.
In the Data Analysis window, choose Anova: Single Factor and click OK.
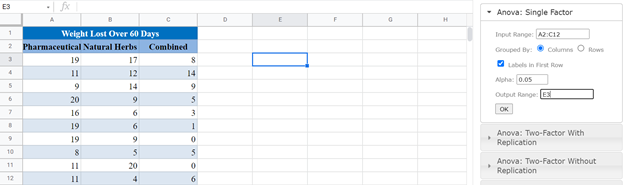
Next, configure the parameters as follows:
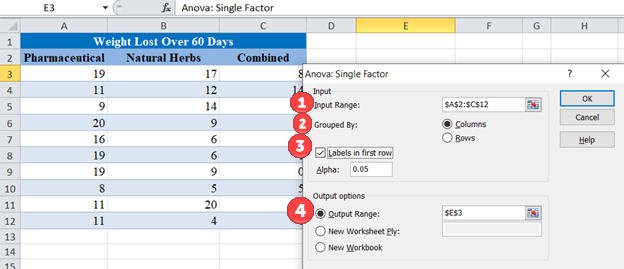
- Select the cells containing the source data.
- Select the “Columns” radio box.
- Make sure “Labels in first row” is checked if the selected range contains column headers.
- Select the desired output option. To get the results on the same sheet, select the Output range and specify the specific reference to the cell into which to display the matrix. In our case it is $E$3.
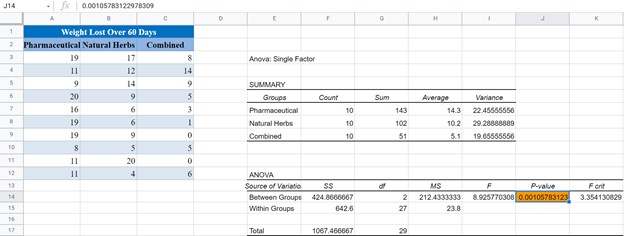
The output for the ANOVA test is as follows:
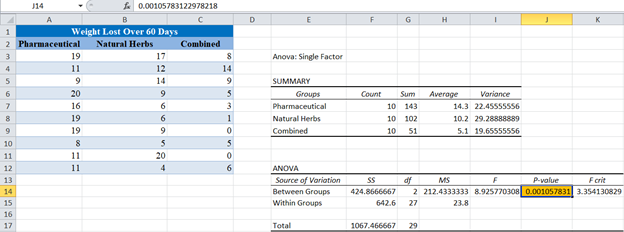
From the ANOVA Test output above, you can see that the p-value is 0.0011 which is less than our significance level of 5% or 0.05. This implies that at least one of the means of the groups is significantly different from the others. However, we do not know the group(s) that contributes to this difference, hence the need for Tukey’s HSD Test.
<<Learn more on How to Perform an ANOVA Test here.>>
The Tukey’s test is performed as follows:
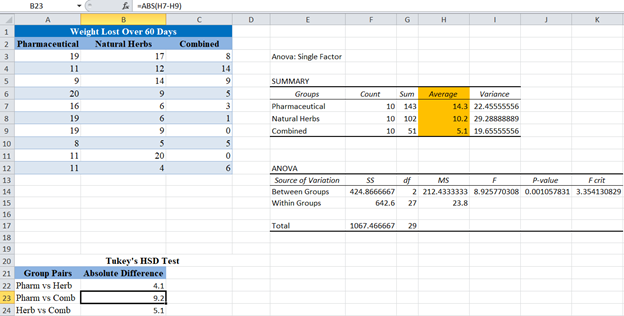
First, set up the groups in pairs.
Next, obtain the absolute values (positive values) of the difference in the means of each pair using the ABS function.
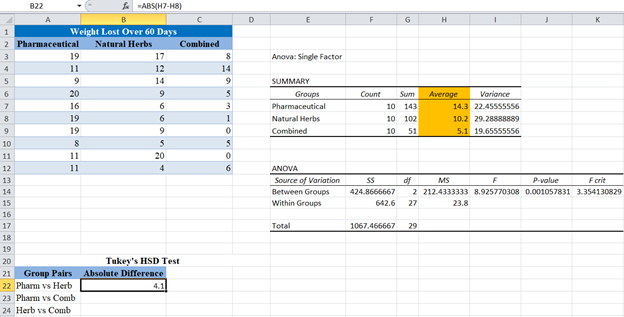
You can get the averages (means) for each group in the “SUMMARY” section of the ANOVA Test result.
Complete the absolute differences for the rest of the group pairs.
Next, calculate the Standard Error (SE) from the ANOVA output.
The Standard Error (SE) is giving by the formula
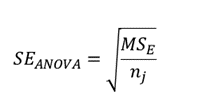
![]() can be found under the column, in the Within Groups row of the ANOVA section of the ANOVA test result, and
can be found under the column, in the Within Groups row of the ANOVA section of the ANOVA test result, and ![]() is the sample size from each group, which is 10 for all the groups.
is the sample size from each group, which is 10 for all the groups.
Next, we calculate the q score for each of the pairs. The q score is given by the formula:
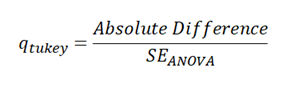
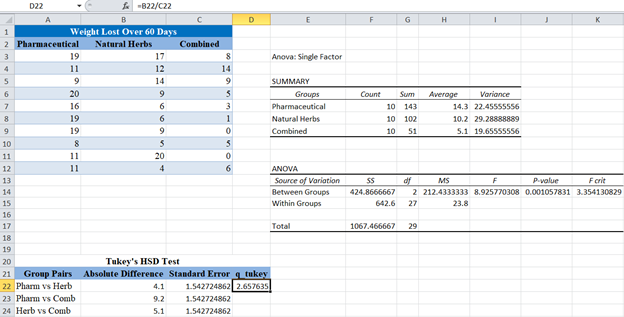
Complete the same for the rest of the pairs.
Finally, compare the calculated q_tukey scores above with the q critical value for the given number of groups, degree of freedom, and significance level.
Here, the number of groups is 3 and the degree of freedom of the denominator is 27 as can be seen under the df column in the Within Groups row of the ANOVA section of the ANOVA test result. An excerpt of the q table for 5% significance level is shown below:
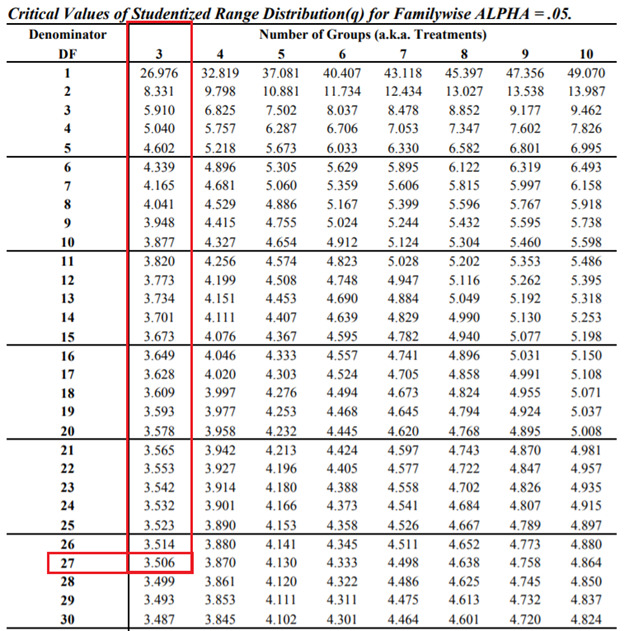
From the table, you can see that the critical level for 5% significant level, 3 groups, and degree of freedom of the denominator of 27 is 3.506.
Comparing this value with the q_tukey scores obtained, you can see that there is a significant difference between the mean weight loss of those in the pharmaceutical medicines therapy and the combined pharmaceutical and natural herbs therapies because it q score of 3.5 is greater than the q critical level.
However, there is no significant difference between the mean weight loss of those in the pharmaceutical medicines therapy and natural herbs therapy and between the mean weight loss of those in the natural herbs therapy and the combined pharmaceutical and natural herbs therapies because their q scores of 2.66 and 3.31 respectively are less than the q critical level of 3.5
Using 3rd Party Excel Add-ins
Excel does not have a specialized function for performing Tukey’s test. However, there are some available third-party Add-ins with the capability of performing Tukey’s test. Some are free while others are premium. One of such Add-ins that is good and free to use is the Xrealstats Add-in from Real Statistics. Xrealstats add-in not only adds additional functions to the in-built Excel functions but also has a Data Analysis Tool.
For instructions on how to download and install Xrealstats add-in, visit the Real Statistics website.
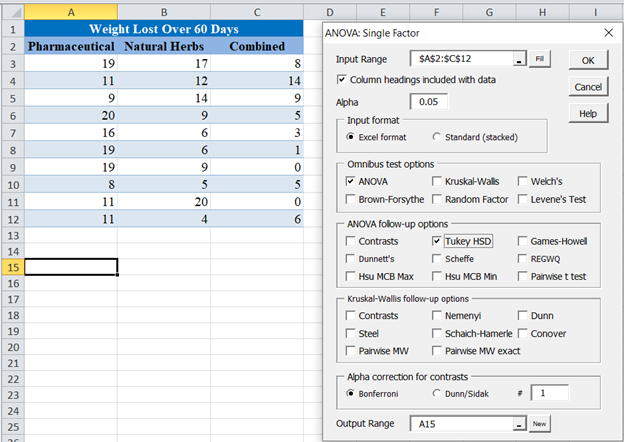
We perform the Tukey’s test on our Weight Loss over 60 Days example using the Xrealstats add-in as follows:
First, select the Real Statistics “Data Analysis Tools” located in Add-Ins Ribbon > Real Statistics.
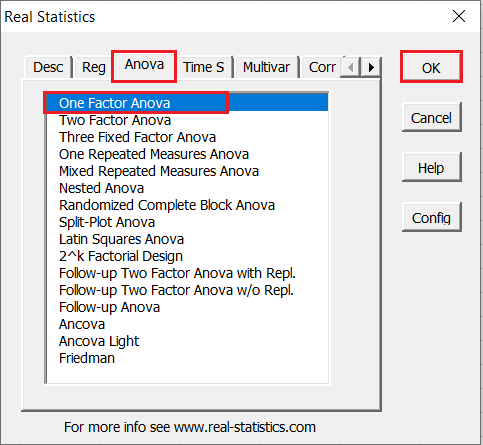
In the Real Statistics window, select the Anova tab and then One Factor Anova and then click OK.
Next, you will need to configure the parameters.
- Click on “Input Range” and select the cells containing the source data.
- Select the “Column headings included with data” checkbox if the selected range contains column headers as shown in the example below.
- Enter the desired significance level in the “Alpha” box. In our case, alpha is 0.05.
- Select the “ANOVA” checkbox in the Omnibus test options section.
- Check the “Tukey HSD” checkbox in the ANOVA follow-up options section.
- Enter the range or the starting cell for the output in the “Output Range” box.
- Then, click “OK”.
The output is as follows:
From the output, you can see that the critical level (q-crit) is 3.506, which when compared to the q-stat for the different pairs. You can see that the q-stat for the Pharmaceutical and Combined pair is 5.96347, which is greater than q-crit, hence is significant.
Conclusion on the pairs that have significantly different means can also be made using the p-value (shown in pink). You can see that the p-value for the Pharmaceutical and Combined pair is 0.00071 which is less than alpha of 0.05, hence is significant.
Tukey Test in Google Sheets
Tukey test can be calculated in Google Sheets as follows.
Firstly, using the XLMiner Analysis Toolpak Add-on, perform an ANOVA Test on the data as follows:
After you have installed the XLMiner Analysis Toolpak add-on, you can find it in the Add-ons tab. Select XLMiner Analysis ToolPak and click on Start.

In the XLMiner Analysis ToolPak window, choose Anova: Single Factor.
In the Anova: Single Factor option dropdown, configure the parameters as follows.
- Select the cells containing the source data and click the “Input Range” box.
- In the “Grouped By” section, select the “Columns” radio box.
- Select the “Labels in first row” checkbox if the selected range contains column headers as shown in the example below.
- Enter the desired output start cell or range in the “Output Range” box.
- Then click “OK”.
The output is as follows:
The next steps are the same as illustrated previously using Excel. The final output is shown below.
