Add Title to Chart – Excel & Google Sheets
Written by
Reviewed by
Last updated on October 30, 2023
This tutorial will demonstrate how to add titles to graphs in Excel and Google Sheets.
Adding Titles to Graphs in Excel
Titles are a good way to explaining the graph that you are looking at. It is a good idea to include titles for all of the graphs that you are working with.
Adding a Title
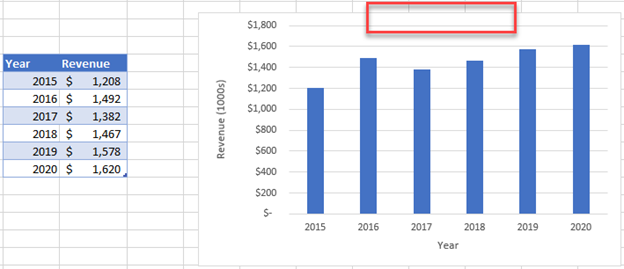
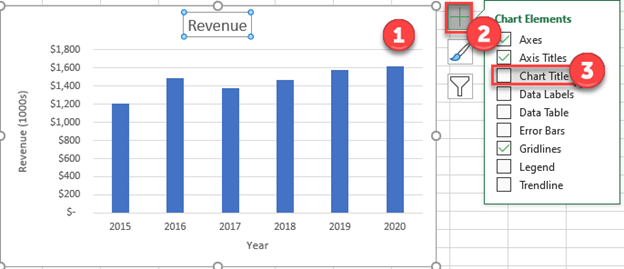
- Click on the Graph
- Click on the + Sign on the top right
- Check Chart Title and a title will show at the top of the graph
Changing Title Name
- Click and highlight the Title
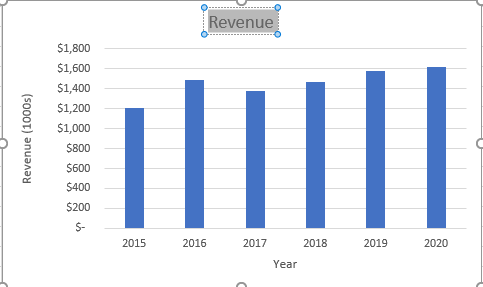
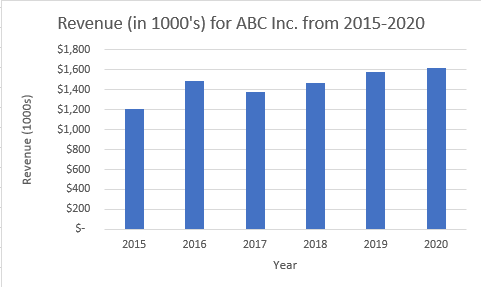
2. Replace the title with a name that gives a clear description of the graph that you are looking at, as seen below.
Create a Dynamic Title Name
You can also create a dynamic chart title that references a cell value. For example, In this scenario, we want to reference the header of the table.
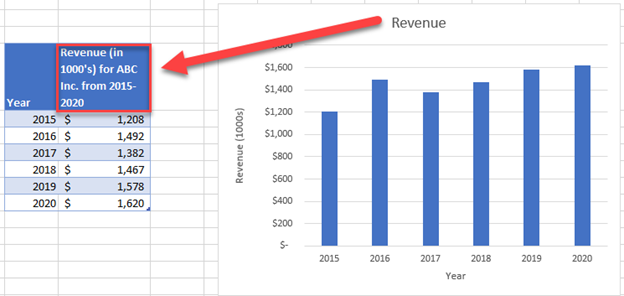
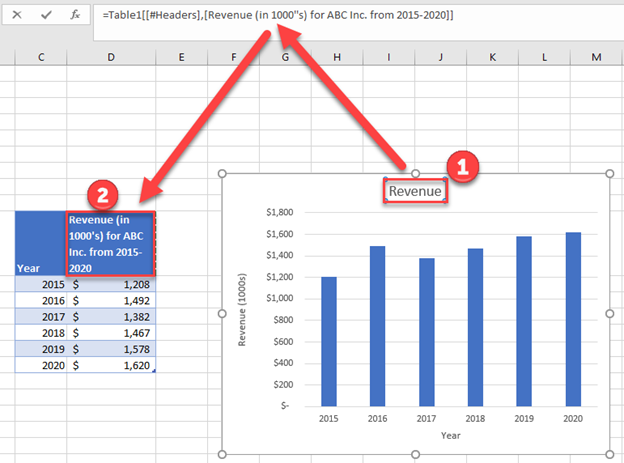
- Click on the Title
- In the formula bar, type = + cell you want to reference
Adding Chart Title in Google Sheets
Similar to Excel, you can add a Chart Title in Google Sheets.
Adding Chart Title
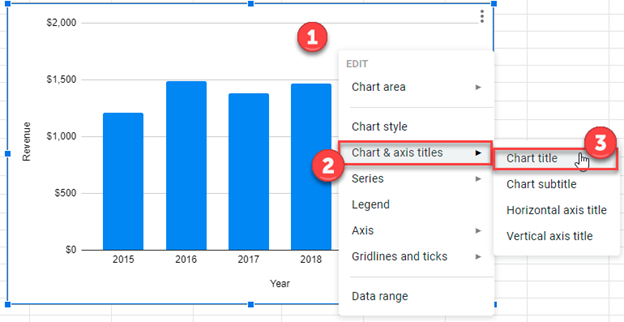
- Right click on the graph
- Select Chart & Axis Titles
- Click Chart Title
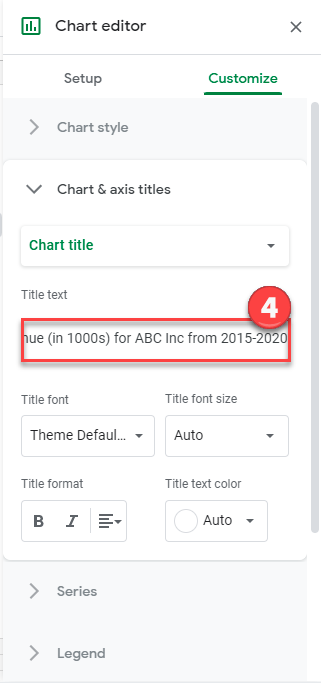
4. Type your New Title for the Chart in the box under Title Text
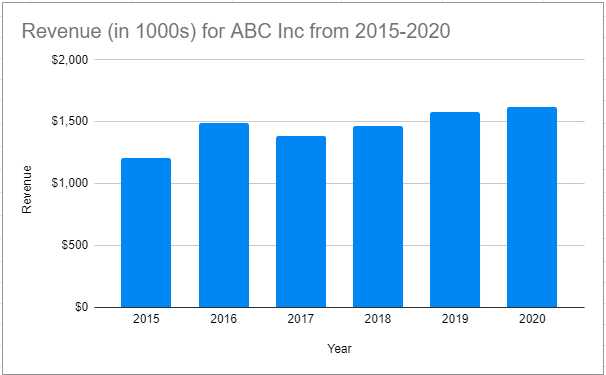
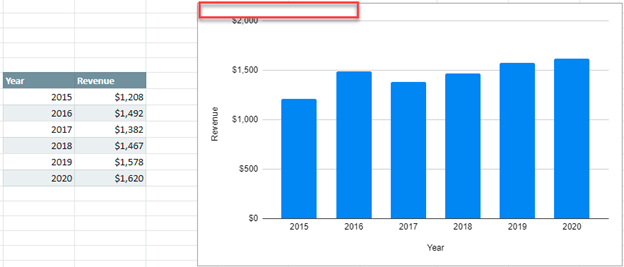
Final Chart with Title
Now the final graph shows a clear understanding of the data that is being shown.