Q-Q Plot – Excel & Google Sheets
Written by
Reviewed by
This tutorial will demonstrate how to create a Q-Q Plot in Excel & Google Sheets.
Q-Q Plot Excel
We’ll start with this dataset showing 10 different values.
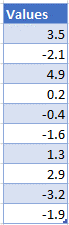
Sorting your Data
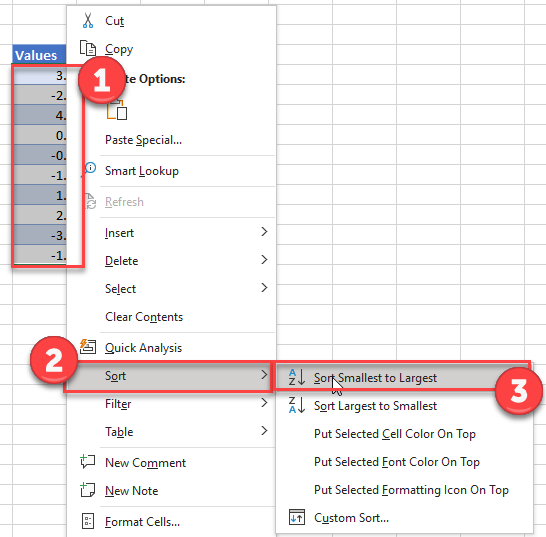
- Highlight and right click on the data
- Select Sort
- Click on Sort Smallest to Largest
Calculate the Rank of Each Value
Add a column “Rank” and use the RANK Function to rank each value.
=RANK(B6,$B$6:$B$15,1)![]()
Note: Above we’ve locked cell references so we can copy and paste the formula down.
Calculate the Percentile of Each Value
Add a Percentile Column and enter the formula with the COUNT Function:
=(C6-0.5)/COUNT($C$6:$C$15)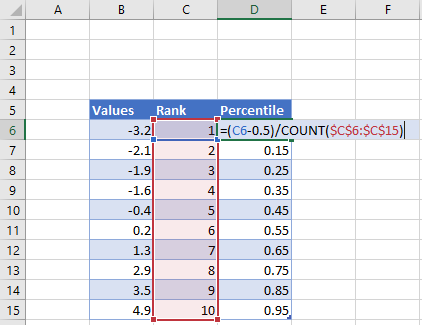
Calculate Z-Score of Each Value
Add a column for Z-Score and enter the NORM.S.INV Function:
=NORM.S.INV(D6)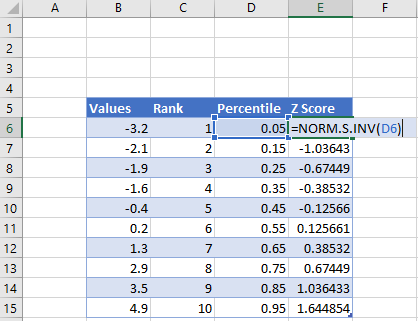
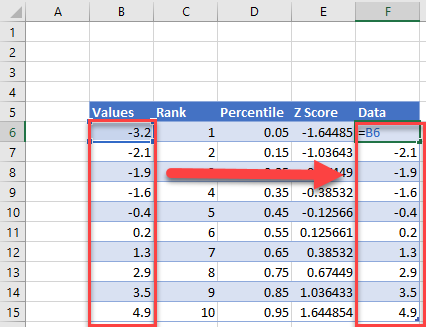
Repeat the Data Column from Column B to Column F
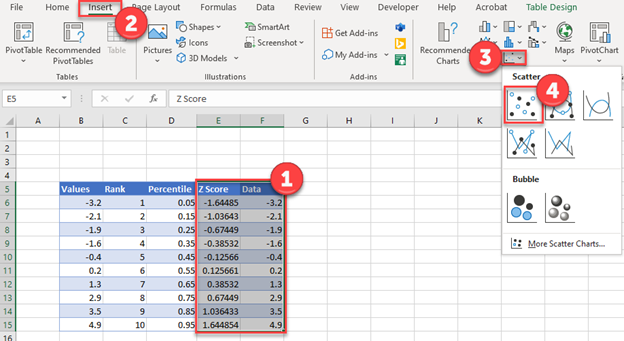
Create the Graph
- Highlight the Z Score and Data
- Select Insert
- Click Scatter
- Click Scatterplot
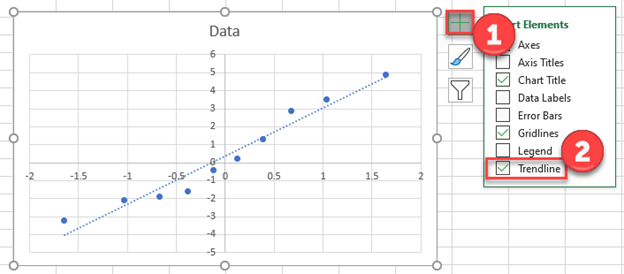
Add a Trendline
- Click on + Sign in top right of the graph
- Select Trendline
Q-Q Plot Google Sheets
Create a Scatterplot
Using the same table as we made in the Excel tutorial
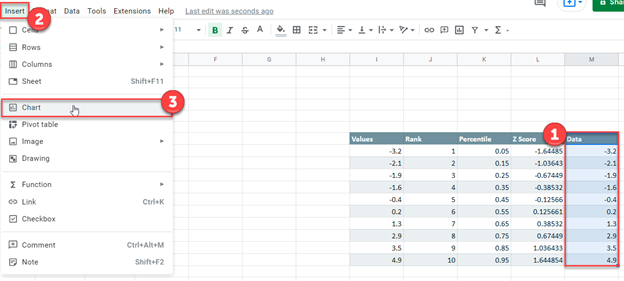
- Highlight the Data Column
- Select Insert
- Click Chart
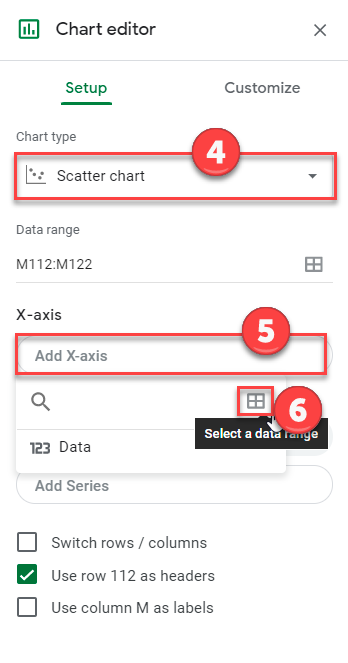
4. Change Chart type to Scatter Chart
5. Click on X-Axis
6. Click Select a data range square
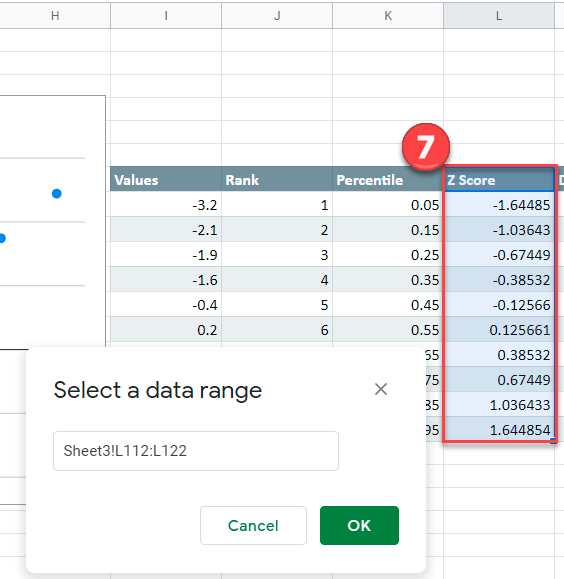
7. Highlight the Z Score Data and click OK.
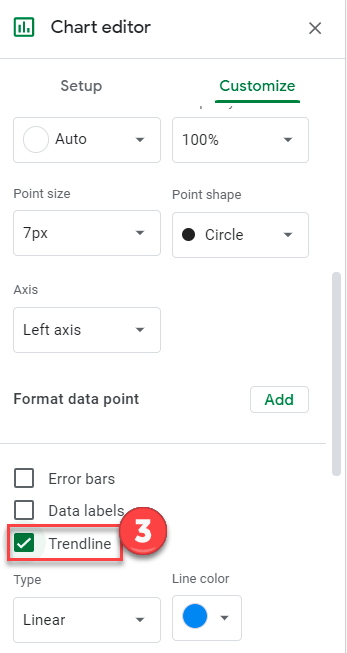
Create a Trendline
- Click on Customize
- Select Series
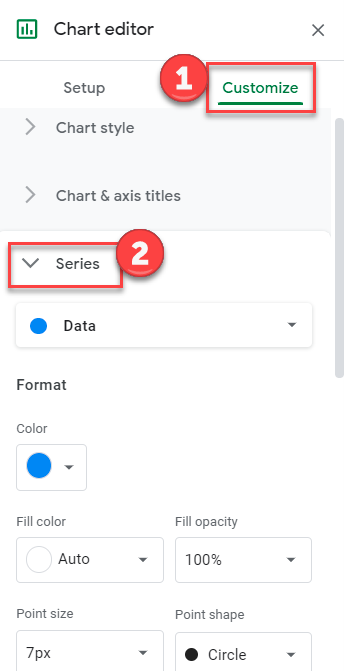
3. Check Trendline
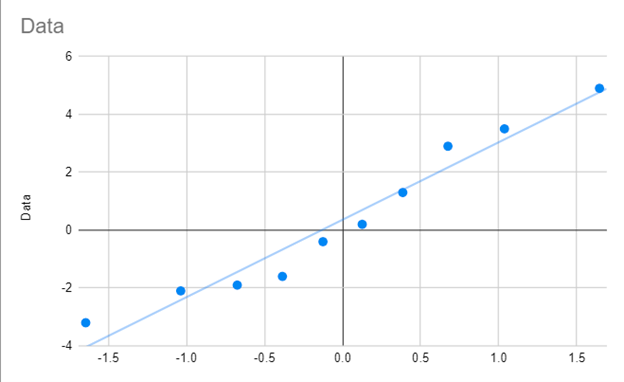
Final Q-Q Graph
Your final Q-Q Graph in Google Sheets should look similar to the one below.