How to Create, Save, & Use Excel Chart Templates
Written by
Reviewed by
In this Article
A chart template is a file containing the colors, layout, formatting, and other settings of a previously created chart for later reuse. Basically, it makes it possible to reapply the same chart parameters to both new and existing graphs in just a few clicks, saving you from having to recreate it every time.
In this article, you will learn everything you need to know about using chart templates in Excel.
Why Chart Templates Are So Incredibly Useful
Chart templates mainly bring two things to the table: automation and consistency.
Let’s assume you run a small store selling electronics. Naturally, that involves regularly putting together monthly sales reports to monitor the demand. But since new data comes in each month, going through the tedious process of building the same chart every single time seems inevitable, right?
Not with chart templates. Instead of plotting the report over and over again, you can save yourself a great deal of time and effort by designing a reusable template.
As an additional bonus, this Excel feature promotes consistency within your organization as everyone uses an identical blueprint for visualizing their data.
Let’s move from theory to practice.
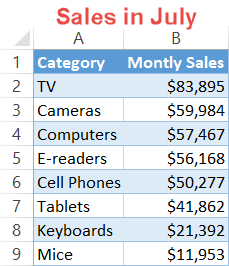
Consider the following data illustrating the company’s sales figures for July:
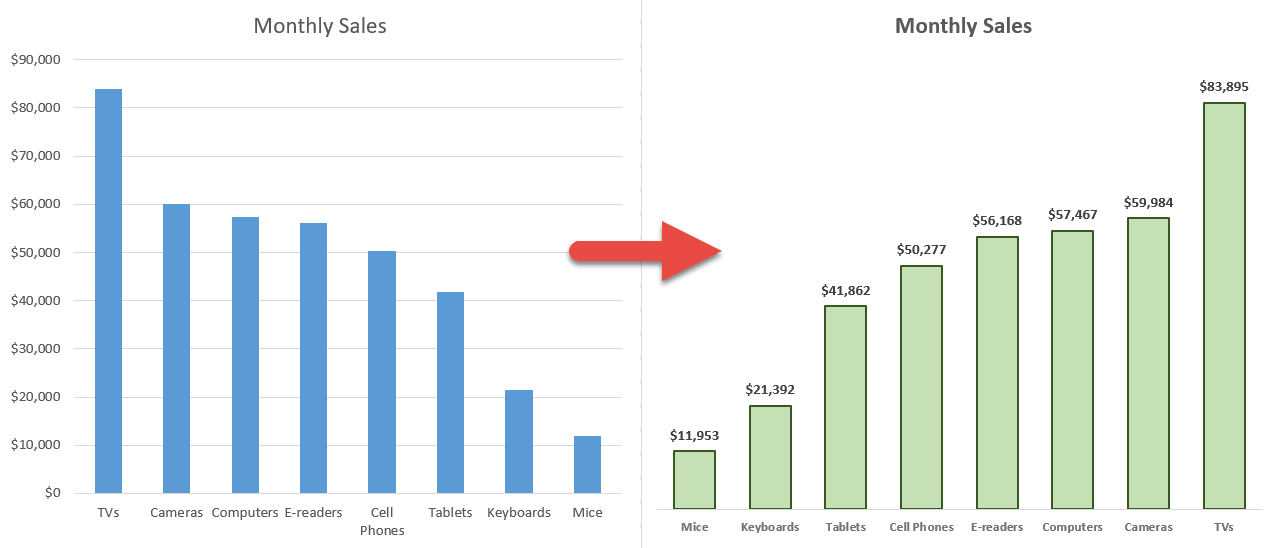
To visualize that data, we are going to opt for a clustered column chart. And here’s what Excel has to offer from its massive variety of built-in visualization tools:

We can do so much better, don’t you think? Let’s customize the chart to make it more informative and colorful.
Now the sales report looks pretty good. However, it took me a multitude of steps to transform the report from dull to engaging. Imagine being stuck with doing that every single month.
And that’s where Excel chart templates charge in to do all the dreary dirty work for you by automating the entire process!
On top of that, it takes less than five minutes to master this handy tool, removing the non-value-added tasks from the equation and saving you countless hours in the long run.
How to Create a Chart Template
First, you have to lay the groundwork: prepare a custom chart that will be used as the future template.
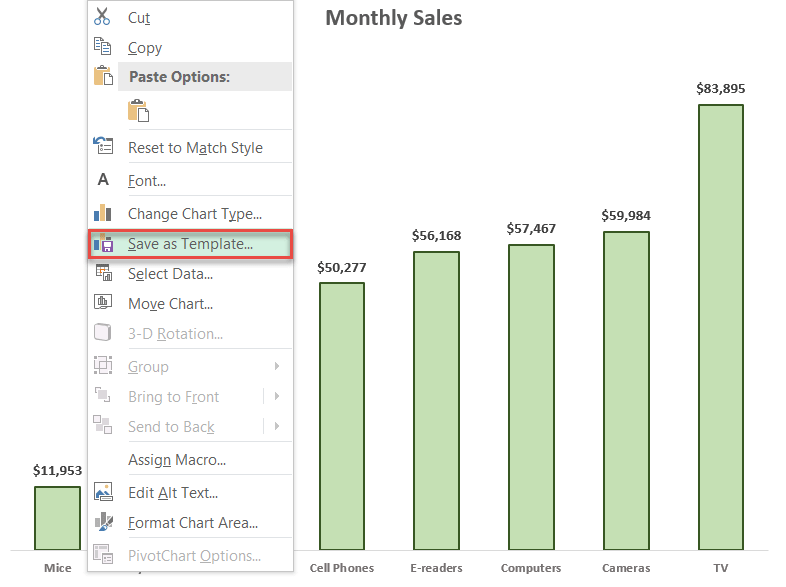
Once the final version of your chart is ready, right-click on the chart area and choose “Save As Template” from the menu that appears.
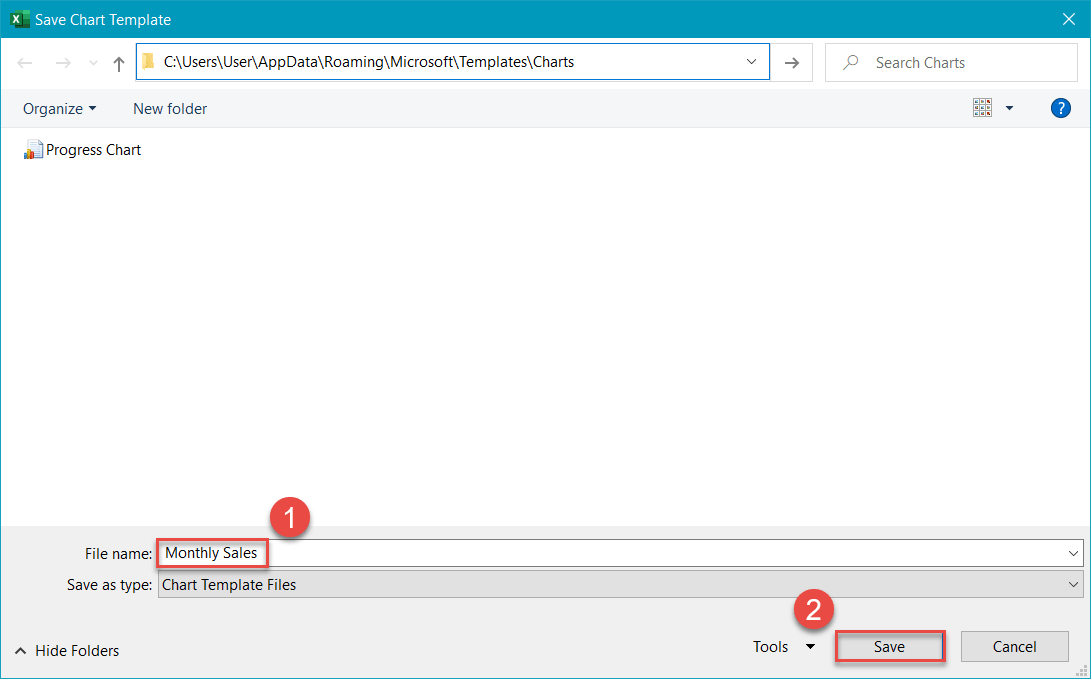
The Save Chart Template dialog box will immediately pop up. In the dialog box, name the chart template and click “Save.”
At that point, a CTRX file containing your chart template data will be created.
Ta-da! You have just saved your first Excel chart template!
How to Apply a Chart Template
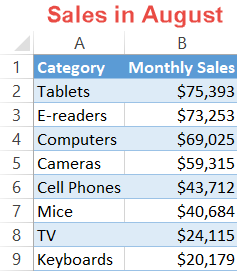
Another month has passed, meaning the opportunity for putting your template to the test has finally come. Consider the August sales report data:
From now on, no more building the same charts from scratch—it’s time to bring in the heavy artillery by applying the saved chart template to that fresh data.
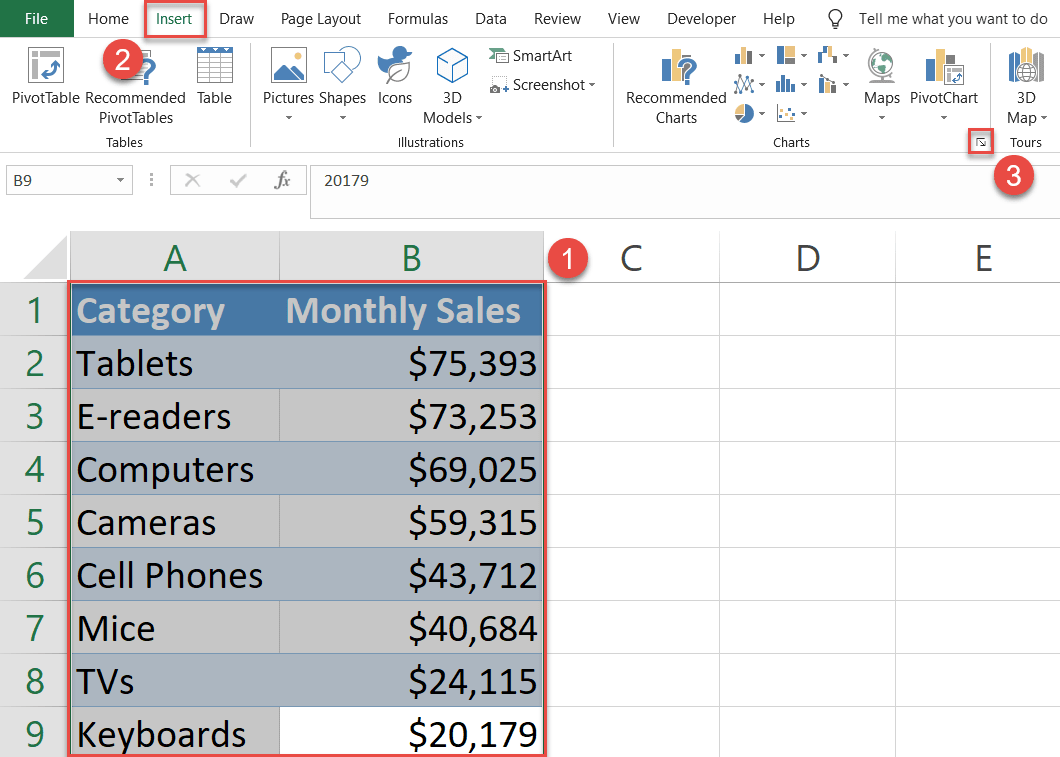
- Highlight your chart data.
- Navigate to the Insert tab.
- Click “See All Charts.”
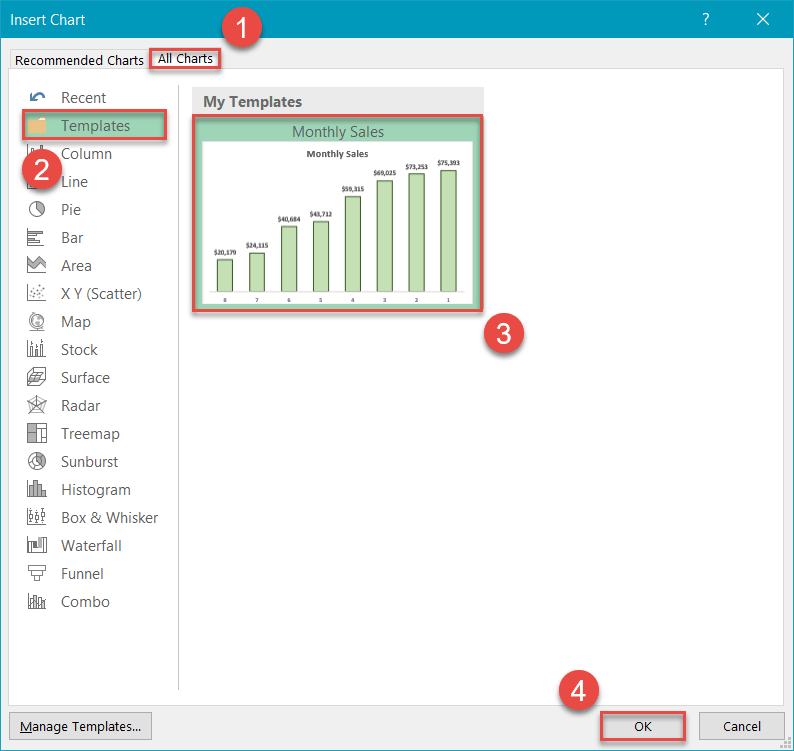
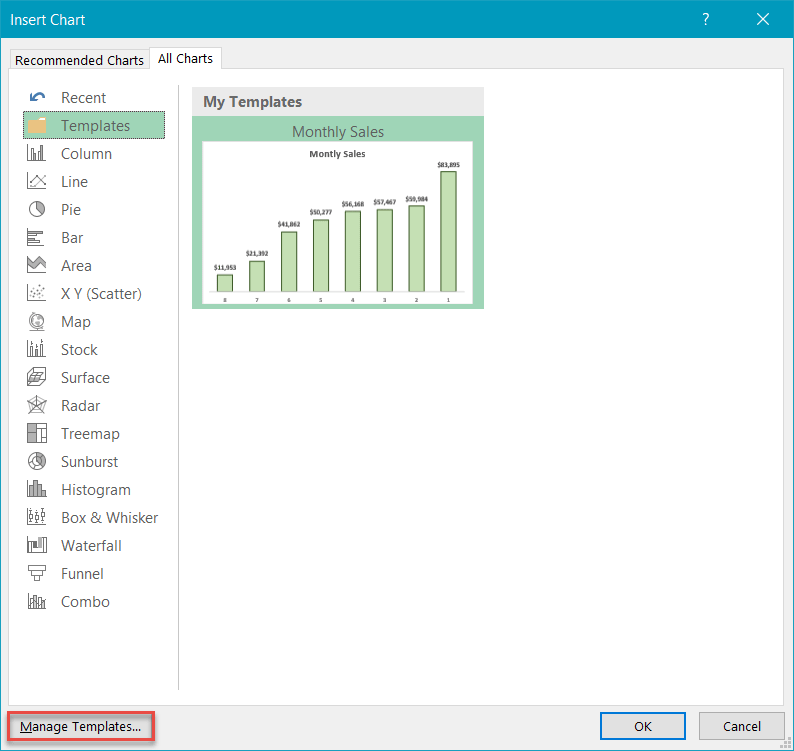
In the Insert Chart dialog box, load the chart template:
- Switch to the All Charts tab.
- On the left sidebar, choose “Templates.”
- In the Templates tab, select your chart template.
- Click “OK.”
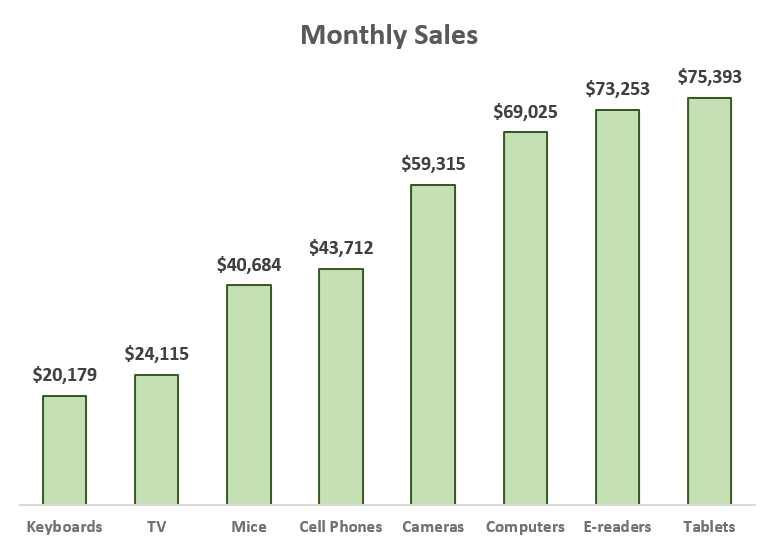
Now, a fully customized chart based on your template will appear. As an example, take a look at the newly created chart below:
But there’s more to it than that.
You can do the same thing with existing charts as well. Whenever you want to apply your chart template to another chart, just follow the few simple steps shown below.
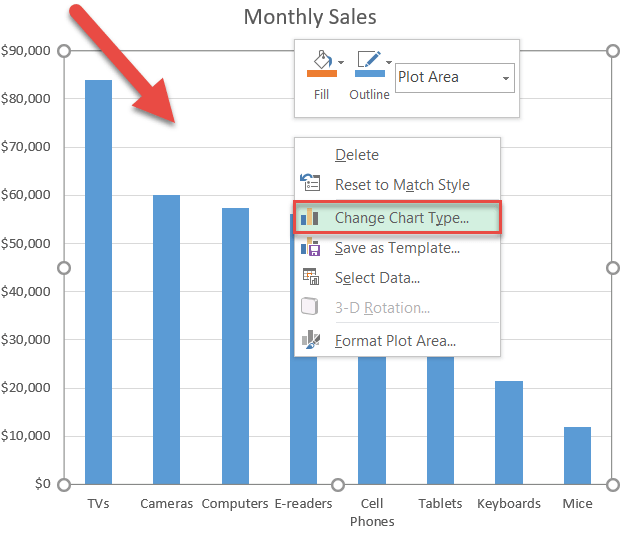
To start with, right-click on the chart plot and select “Change Chart Type.”
In the Change Chart Type dialog box, navigate to the All Charts tab and load your chart template (Templates > Select your template > OK).
How to Add or Delete a Chart Template
In addition to creating your own chart templates, Excel allows you to import third-party chart template files and use them in your projects.
First, access the Charts folder that stores all the CTRX files on your computer.
To do that, navigate to the Insert Chart/Change Chart Type dialog box, open the Templates tab, and click “Manage Templates.”
Another way to go is to open the folder manually, which is typically located here on your computer:
C:\Users\[Your user name]\AppData\Roaming\Microsoft\Templates\Charts
Once you have opened the Charts folder, copy the CTRX file containing the chart template you want to add to this folder, and you’re all set. It’s as simple as that.
Conversely, you can remove any given template by deleting the corresponding CTRX file.
Advanced Excel Chart Templates
Still not impressed?
Well, the sales report used as a running example in this article is nowhere near as time-consuming as advanced Excel charts like gauge charts or thermometer charts, which generally take a lot more time and effort to put together.
Fortunately, when it comes to chart templates, the more complex the chart, the greater the payoff. So, if you’ve built an advanced Excel graph, don’t forget to save it as a template, and it will be available whenever you need it.
That’s it for today. You now have all the information needed to unleash the potential of chart templates in Excel.
