CORREL Function – Correlation in Excel, VBA, Google Sheets
Written by
Reviewed by
Download the example workbook
This Tutorial demonstrates how to use the Excel CORREL Function in Excel to calculate the correlation.
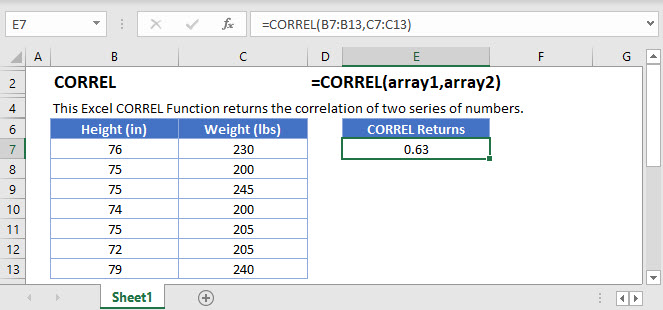
CORREL Function Overview
The CORREL Function Calculates the correlation of two series of numbers.
To use the CORREL Excel Worksheet Function, select a cell and type:

(Notice how the formula inputs appear)
CORREL function Syntax and inputs:
=CORREL(array1,array2)array1 – Arrays of numbers.
What is the CORREL Function?
The Excel CORREL Function returns the correlation coefficient (Pearson’s r) of two data ranges.
What is the Correlation Coefficient?
The correlation coefficient, usually referred to as Pearson’s r (named after Karl Pearson, the person who developed it), is a statistic that tells you how strongly two variables are related.
Pearson’s r is a figure between -1 and 1, which can lead to three possible interpretations: a positive correlation, a negative correlation, and no correlation.
Positive correlation
A positive correlation (r > 0) means that when the two variables are in tandem – when you observe a high score in one variable, you tend to also observe a high score in the other. Likewise, when one variable is low, the other tends to be low too.
For example, height and weight have a positive correlation. See the chart below, which plots the height and weight of a small sample of baseball players:
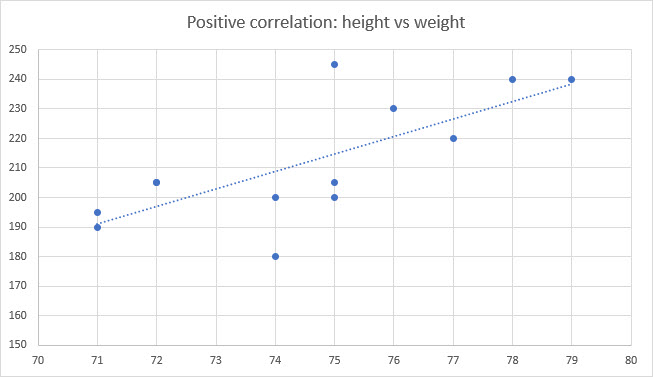
The r of this small sample is 0.73 – a very strong positive correlation. This makes sense logically – taller people tend to be heavier, on average, since that extra height is made up of bones and muscles and other tissue which all weigh something.
But the correlation is not perfect (in a perfect correlation with an r of 1, all scores would fall on the trend line). Some shorter people can be heavier – maybe they carry a bit extra fat, or work out at the gym. Likewise, some tall people might be very skinny, and actually weigh less than many shorter people.
The correlation here is probably so high because we’re dealing with athletes, it would be lower in the overall population. Remember to keep this in mind when using CORREL – the r you get is not definitive – you need to think about what your data is and how you got it when making your interpretations.
Negative correlation
A negative correlation (r < 0) means that when you observe a high score in one variable, you tend to observe a low score in the other variable, and vice-versa.
For example, students’ test scores and the number of absences they had from school are negatively correlated. That is, the more days they miss, the lower their scores tend to be. The fewer days they miss, the higher the scores tend to be:
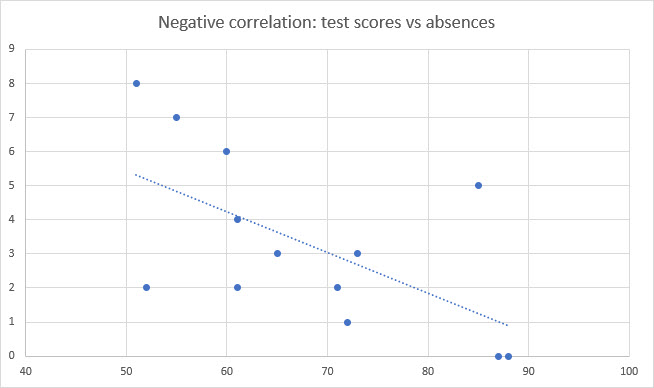
Again, the correlation is not perfect (as they almost never are). We have one student here who missed 5 days, but still managed to score 85%. We also have one who scored 52%, despite only missing two days.
We still have a clear negative trend. But there’s still a lot of variation in test results that can’t be explained by absence alone. This might be due to other variables, like aptitude, motivation, health, and many other potential factors.
So when you use CORREL, keep in mind that there’s a larger picture that your data might not be fully explaining.
No correlation
No correlation (r = 0 or is close to 0) means you cannot predict the score of one variable based on another. If you plot the data, you will see no discernable trend, and the trend line will be flat or near-flat.
Here is some data on ring finger length and IQ:
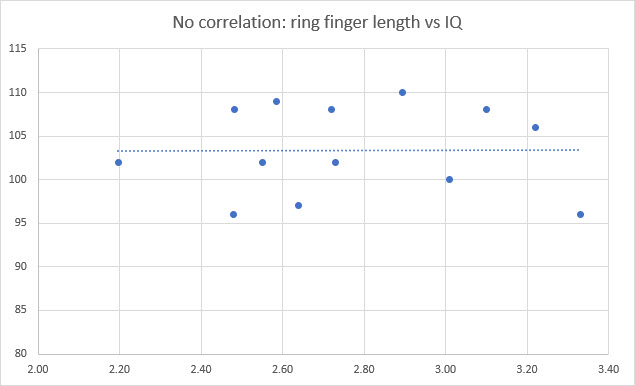
As you can see, there’s no connection between these two variables in this sample, so we can assume they are unrelated.
In practice, you’re unlikely to get an r of exactly 0. Remember that when collecting data, there is often some variation due to error, perhaps in measurement or reporting. So just because your r isn’t exactly 0, doesn’t mean you’ve found something.
Correlation is not causation
It’s crucial to keep in mind that CORREL cannot tell you which variable is influencing the other – or even if there is any causal relationship between variables at all. For example, a correlation has been found between the following variables:
- The amount of ice cream sold, and the amount of violent crime
- How happy you are and how successful you are in your career
- The number of people who drowned in a pool and the number of movies Nicolas Cage appeared in per year
The first example is the third variable problem. Of course, ice cream doesn’t make people violent, nor does engaging in violence trigger a craving for frozen milk and sugar. The third variable is the weather. In hot weather, people simply go out more – there’s more contact between people, and so more chance of a conflict brewing up. In hot weather, people also buy more ice cream. So ice cream sales and violent crime only correlate because they are both linked to a third variable.
The second could be an example of dual causality. Being successful at work can be good for your happiness – you’ll earn more money and generally will have more control over what work you do and who you do it with. But happiness might be beneficial to success too, maybe happier people are easier to get along with and develop stronger working relationships, or maybe they are more mentally resilient to setbacks. In this case, both variables are influencing each other.
The third is simply a spurious correlation. Just because two variables correlate in your data, doesn’t mean they interact in anyway in real life.
The bottom line is, a correlation cannot tell you whether two variables are causally connected.
How to use CORREL
Use the Excel CORREL Function like this:
=CORREL(B3:B15,C3:C15)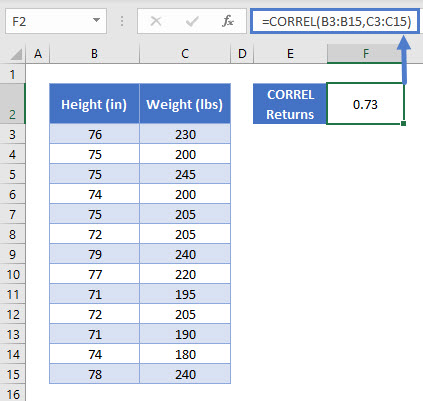
With CORREL you define two arguments – the two data ranges that you want to correlate.
Here are a few key points to keep in mind with CORREL:
- Text, Boolean (TRUE/FALSE), and empty cells are ignored.
- Both data ranges must have an equal number of data points, otherwise you’ll get an #N/A error
- If one of the data ranges is empty, of if there is no variation at all in the data (i.e., if all data points are the same number), you’ll get a #DIV/0! Error
CORREL Function in Google Sheets
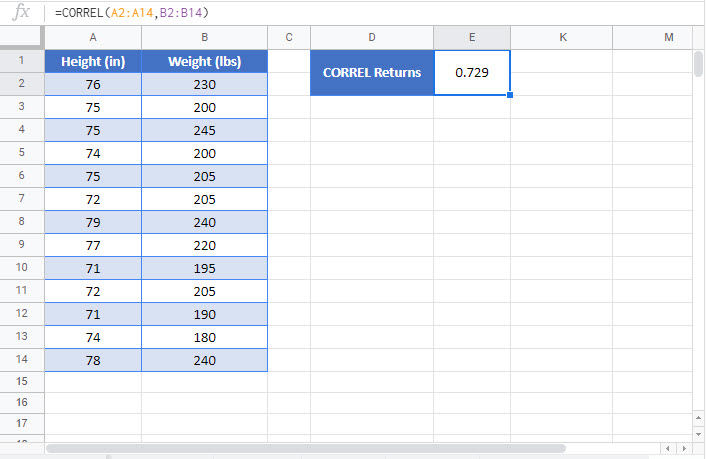
The CORREL Function works exactly the same in Google Sheets as in Excel:
Additional Notes
CORREL Examples in VBA
You can also use the CORREL function in VBA. Type:
application.worksheetfunction.correl(array1,array2)For the function arguments (array1, etc.), you can either enter them directly into the function, or define variables to use instead.
Return to the List of all Functions in Excel


