DAVERAGE Function Examples – Excel & Google Sheets
Written by
Reviewed by
This tutorial demonstrates how to use the DAVERAGE Function in Excel.
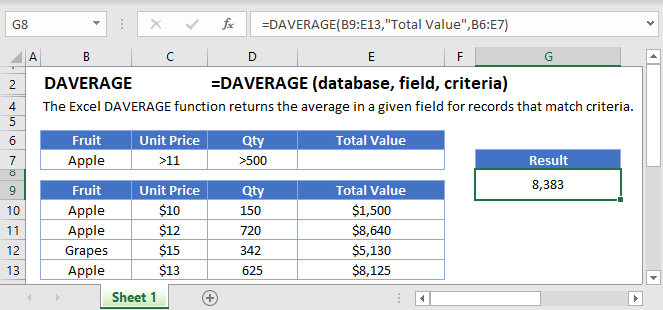
What is the DAVERAGE Function?
DAVERAGE is one of Excel’s database functions. It returns the average (arithmetic mean) of a column in a database, after first applying a range of filters to the data.
In this context, “database” simply refers to a table of data in Excel with column headers.
What is the Arithmetic Mean?
The arithmetic mean, usually just referred to as the mean, is the sum of a set of numbers, divided by how many numbers there are in the set.
Here’s a basic example. Take the set of numbers 1,2,3,4,5. The sum of these numbers is 15, and there are five numbers in the set. Therefore, the mean is:
15 / 5 = 3Sensitivity to Outliers
An outlier is an extreme value in a set of numbers – one that lies far from the main cluster of the other data points.
The mean is very sensitive to outliers, which can make it a poor representation of data that contains extreme values.
See the example below:
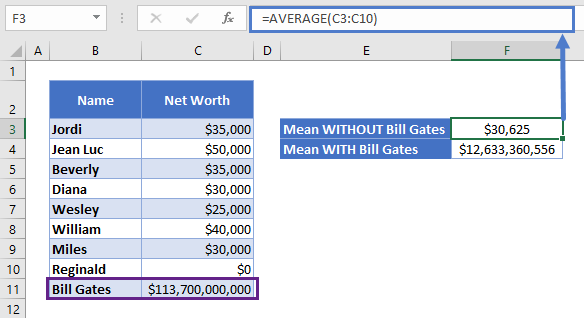
Here a group of people have a mean net worth of $30,625 – a fair representation of the group. But if we add Bill Gates to the group, he raises the mean net worth to over $12bn – which is not a useful estimation of anyone in the group.
If your data contains outliers, the median may be a better choice. See the Excel MEDIAN Function for more information.
How to Use the DAVERAGE Function
To use the Excel DAVERAGE Function, type the following:
=DAVERAGE(B7:F19,3,B3:F4)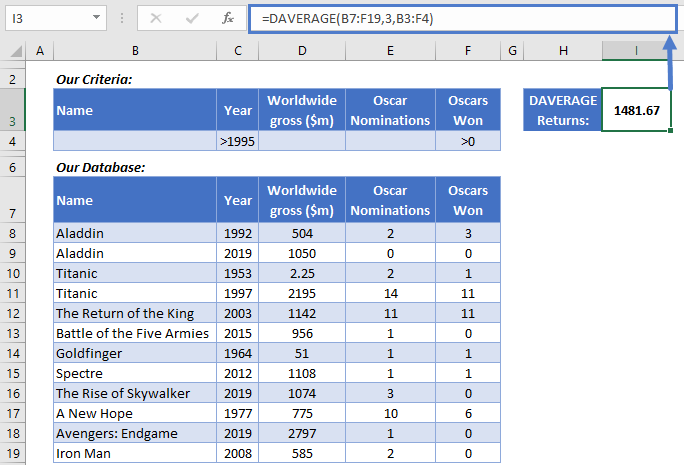
Here is a small database with information on a few movies. We want to know the average worldwide gross of movies released after 1995 that won at least one Oscar.
Here’s how DAVERAGE gets that information for us:
- The first argument is the database, which is the table in B7:F19. Note that we’ve included the column headers in the range.
- The second argument is the column we want to average. We’ve referred to it by its numerical position, 3, but we could use its name in quotes, e.g., “Worldwide gross ($m)”.
- The third argument defines the filters we want to apply before calculating the mean. These are in another table, in cells B3:F4.
To filter the data, we simply add the criteria we need to the criteria table. Here we’ve filtered on a “Year” greater than 1995, and “Oscars Won” greater than 0.
Three movies meet our criteria: Titanic ($2195m), Return of the King ($1142m), and Spectre ($1108m). If we add up these figures, and divide by three, we get $1481.67m – and that’s what DAVERAGE has correctly returned.
DAVERAGE Includes Numerical Values Only
DAVERAGE will only include rows with numerical data in its calculation and will ignore cells containing text.
If you try to use DAVERAGE on a cell that only contains text, you’ll get a #DIV/0! Error. See below:
=DAVERAGE(B7:F19,"Name",B3:F4)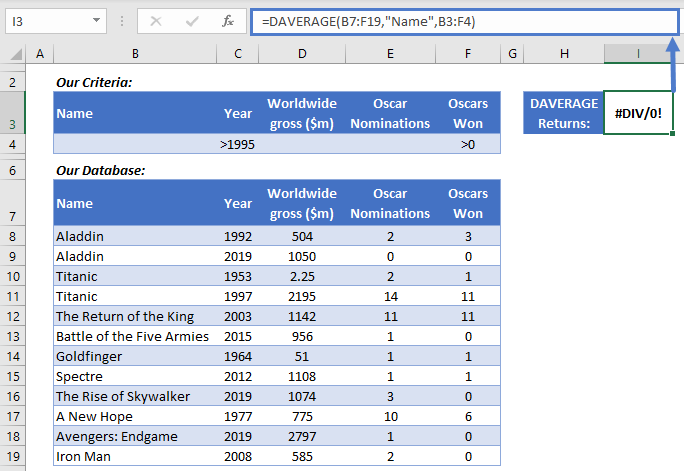
Because DAVERAGE finds no values in the set, it tries to divide the total value (0) by the number of values in the set (also 0). Since you cannot divide by zero, it returns the error.
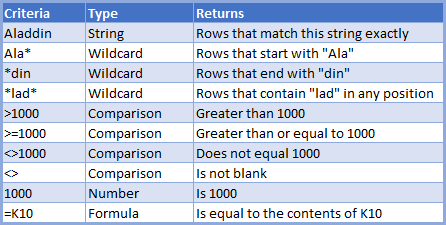
What You Can Use as Criteria
DAVERAGE enables you to use a range of different criteria in your criteria table, including:
Using Multiple Criteria Rows
You can add multiple rows to your criteria table.
DAVERAGE uses “OR” logic to evaluate multiple rows. This means Excel will go through each row in the database one-by-one and compare them to the rows in your criteria table. If it matches any of your criteria rows, DAVERAGE will include it when calculating the average.
Here’s an example:
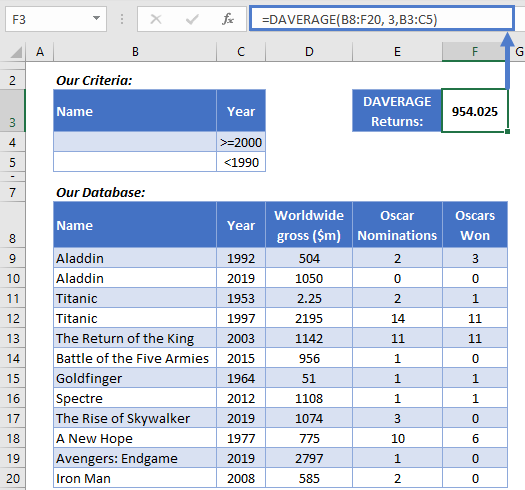
Here we have two criteria rows, one returning movies released on or after the year 2000, and one returning movies released before 1990. So we’re excluding all 90s movies and taking the average of the rest. Our result is $954m.
Use AVERAGE When You Don’t Need to Filter the Data
DAVERAGE is a powerful tool when you need to filter the data in complex ways. But if you don’t need to use filters, use AVERAGE instead.
You use AVERAGE like this:
=AVERAGE(C3:C14)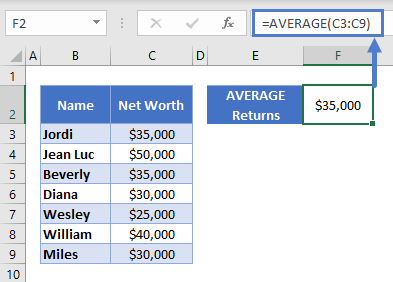
As shown here, you simply define the range containing your data, and Excel returns the mean of any numerical cells inside that range.
Use AVERAGEA When You Need to Include Text and Boolean Values
AVERAGEA is another function that returns the mean of a range of values, however unlike AVERAGE, it includes text and Boolean (TRUE or FALSE) values when making its calculations.
Use it like this:
=AVERAGEA(B3:B9)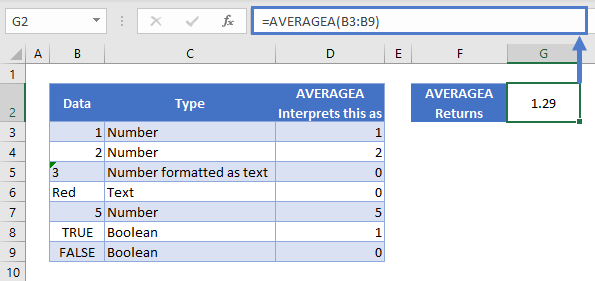
As you can see here, AVERAGEA interprets cells containing text as 0, cells containing TRUE as 1, and cells containing FALSE as 0.
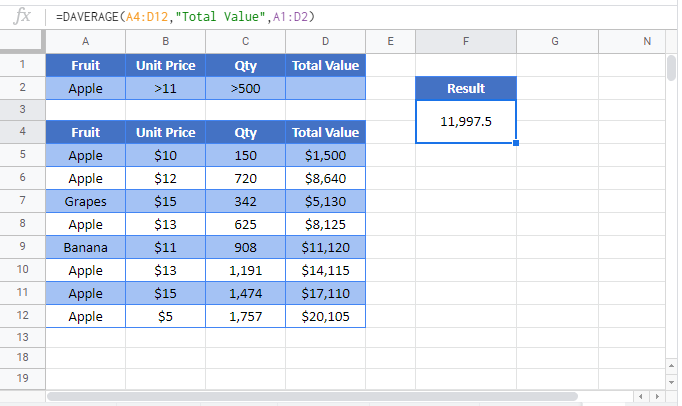
DAVERAGE in Google Sheets
The DAVERAGE Function works exactly the same in Google Sheets as in Excel: