Standard Deviation – Excel and Google Sheets
Written by
Reviewed by
This Tutorial demonstrates how to use the Excel Standard Deviation Function in Excel to calculate standard deviation for an entire population.
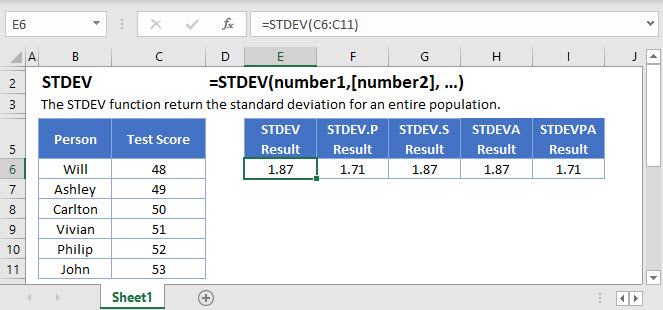
STANDARD DEVIATION Function Overview
The STANDARD DEVIATION Function Calculates calculate standard deviation for an entire population.
To use the STANDARD DEVIATION Excel Worksheet Function, select a cell and type:
![]()
(Notice how the formula inputs appear)
STANDARD DEVIATION function Syntax and inputs:
=STDEV(number1,[number2], …)numbers– Values to get Standard Variance
How to Calculate the Standard Deviation in Excel
Whenever you’re dealing with data, you’ll want to run some basic tests to help you understand it. You’ll typically start by calculating the mean, using the Excel AVERAGE Function<<link>>.
This give you an idea of where the “middle” of the data is. And from there, you’ll want to look at how spread out the data is around this middle point. This is where the standard deviation comes in.
Excel gives you a number of functions to calculate the standard deviation – STDEV, STDEV.P, STDEV.S, and DSTDEV. We’ll get to all of them, but first, let’s learn what the standard deviation is, exactly.
What is the Standard Deviation?
The standard deviation gives you an idea of how far your data points are from the mean. Take the following data set of test scores out of 100:
48,49,50,51,52The mean of this data set is 50 (add up all the numbers, and divide by n, where n is the number of values in the range).
Now look at this next set of data:
10,25,50,75,90The mean of this data set is also 50 – but the two ranges tell a very different story. If you just used the mean, you might think the two groups were about equal in their aptitude – and on average, they are.
But in the first group, we have 5 people who got very similar, very mediocre scores. And in the second group, we a couple of high-fliers balanced out by a couple of poor-scorers, with one person in the middle. The spread of the scores is very different, making your interpretation of the data very different too.
The standard deviation is a measure of this spread.
How the Standard Deviation is Calculated
To understand what the standard deviation is and how it works, it can help to work through an example by hand. That way, you’ll know what’s going on “under-the-hood” once we get to the Excel functions that you can use.
To calculate the standard deviation, you work through this process:
1) Calculate the Mean
Let’s take our first data set above: 48,49,50,51,52
We already know the mean (50), which I’ve confirmed here with the Excel AVERAGE Function<<link>>:
=AVERAGE(C4:C8)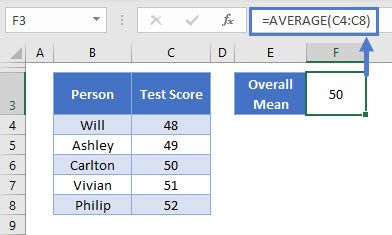
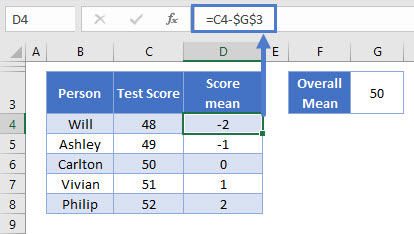
2) Subtract the Mean from Each Value in the Data Set
I’ve done this with the following formula:
=C4-$H$4Our mean is in H4, and I’ve “locked” the cell reference by putting the dollar signs before the column and row (by pressing F4). This means I can copy the formula down the column without the cell reference updating.
The result:
Now, let’s pause here for a second. If you take a look at the new column – you’ll see that the numbers here add up to zero. The mean of these numbers, is also zero.
Of course, the spread of our data cannot be zero – we know there is some variation there. We need a way to represent this variation, without the average turning out to be zero.
3) Square the Differences
We can achieve this by squaring the differences. So, let’s add a new column, and square the numbers in the D column:
=D4*D4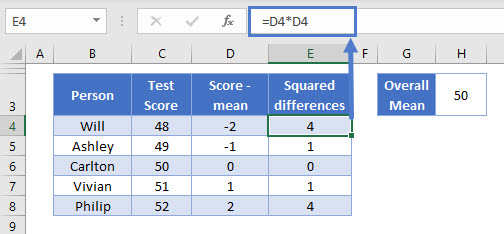
This is looking better. Now we have some variation, and the amount of variation is related to how far each score is from the mean.
4) Calculate the Variance – the Mean of the Squared Differences
The next step, is to get the average of those squared differences. There are actually two ways to do this when calculating the standard deviation.
- If you are using population data, you simply take the mean (sum up the values, and divide by n)
- If you are using sample data, you take sum the values, and divide by n-1
Population data means you have the “full set” of your data, for example, you have data on every student in a given class.
Sample data means you don’t have all your data, just a sample taken from a larger population. Typically, your goal with sample data is to make an estimate of what the value is in the larger population.
A political opinion poll is a good example of sample data – researchers survey, say, 1,000 people to get an idea of what a whole country or state is thinking.
Here we don’t have a sample. We just have five statistically-minded family members who want to calculate the standard deviation of a test they all took. We have all the data points, and we are not making an estimate of a larger group of people. This is population data – so we can just take the average here:
=AVERAGE(E4:E8)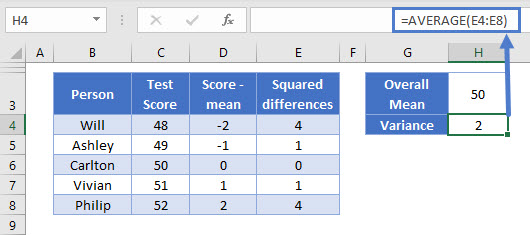
OK, so we’ve got 2. This score is known as the “variance”, and it’s the base point for a lot of statistical tests, including the standard deviation. You can read more about the variance on its main page: how to calculate variance in Excel<<link>>.
5) Get the Square Root of the Variance
We squared our numbers earlier, which obviously inflates the values a bit. So to bring the figure back in line with the actual differences of the scores from the mean, we need to square root the result of step 4:
=SQRT(H4)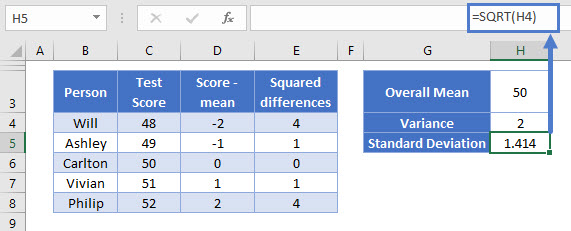
And we have our result: the standard deviation is 1.414
Because we’ve square rooted our previously squared numbers, the standard deviation given in the same units as the original data. So out standard deviation here is 1.414 test points.
Standard Deviation When the Data is More Spread-Out
Earlier we had a second example data range: 10,25,50,75,90
Just for fun, let’s see what happens when we calculate the standard deviation on this data:
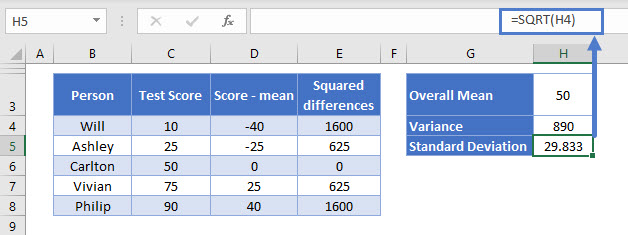
All of the formulas are exactly the same as before (note that the Overall Mean is still 50).
The only thing that changed was the spread of the scores in column C. But now, our standard deviation is much higher, at 29.832 test points.
Of course, since we only have 5 data points, it’s very easy to see that the spread of the scores is different between the two sets. But when you have 100s or 1,000’s of data points, you can’t tell that by just quickly scanning the data. And that’s exactly why we use the standard deviation.
The Excel Functions to Calculate the Standard Deviation
Now that you know how the standard deviation works, you don’t need to go through that whole process to arrive at the standard deviation. You can just use one of Excel’s built-in functions.
Excel has several functions for this purpose:
- P calculates the standard deviation for population data (using the exact method we used in the above example)
- S calculates the standard deviation for sample data (using the n-1 method we touched on earlier)
- STDEV is exactly the same as STDEV.S. This is an older function that has been replaced by STDEV.S and STDEV.P.
- STDEVA is very similar to STDEV.S, except that it includes text cells and Boolean (TRUE/FALSE) cells when making its calculation.
- STDEVPA is very similar to STDEV.P, except that it includes text cells and Boolean (TRUE/FALSE) cells when making its calculation.
Wow, a lot of options here! Don’t be intimidated – in the vast majority of the cases, you’ll be using either STDEV.P or STDEV.S.
Let’s go through each of these in-turn, starting with STDEV.P, since that’s the method we just worked through.
The Excel STDEV.P Function
STDEV.P calculates the standard deviation for population data. You use it like this:
=STDEV.P(C4:C8)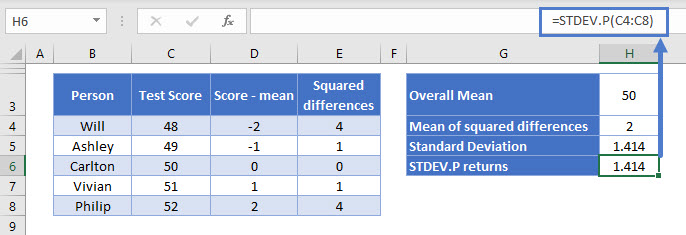
You define one argument in STDEV.P: the data range for which you want to calculate the standard deviation.
This is the same example we walked through step-by-step above when we calculated the standard deviation by hand. And as you can see above, we get exactly the same result – 1.414.
Note STDEV.P ignores any cells containing text or Boolean (TRUE/FALSE) values. If you need to include these, use STDEVPA.
The Excel STDEV.S Function
STDEV.S calculates the standard deviation for sample data. Use it like this:
=STDEV.S(C4:C8)Again, it takes one argument – the range of data for which you want to know the standard deviation.
Before we get into an example, let’s discuss the difference between STDEV.S and STDEV.P.
As we’ve already discussed, STDEV.S should be used on sample data – when your data is a portion of a larger set. So let’s assume now, that in our example above, more people had taken the test. We want to estimate the standard deviation of everyone who took the test, using just these five scores. Now we’re using sample data.
Now, the calculation differs from step (4) above, when we’re calculating the variance – the average of the squared difference of each score from the overall mean.
Instead of using the normal method – sum up all the values, and divide by n, we would sum up all the values and divide by n-1:
=SUM(E4:E8) / (COUNT(E4:E8)-1)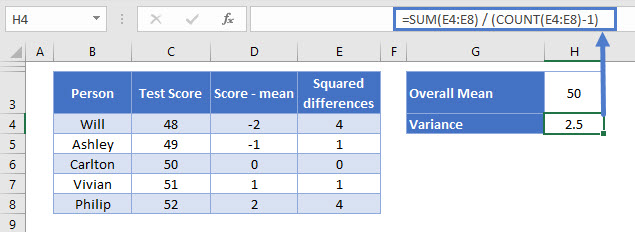
In this formula:
- SUM gets the sum of the squared differences
- COUNT returns our n, which we subtract 1 from
- We then simply divide our sum by our n-1
This time, the mean of squared differences is 2.5 (you may recall it was 2 previously, so it’s a little higher).
So why do we divide by n-1 instead of n when dealing with sample data?
The answer is fairly complex, and if you’re just trying to run your numbers to understand your data, it’s not something you really need to concern yourself with. Just make sure you’re using STDEV.S for sample data, and STDEV.P for population data, and you’ll be fine.
If you’re really curious to know why, see the main page on how to calculate variance in Excel<<link>>.
OK so we’ve got the variance for the sample now, so to get the standard deviation for the sample, we’d just get the square root of the variance:
=SQRT(H4)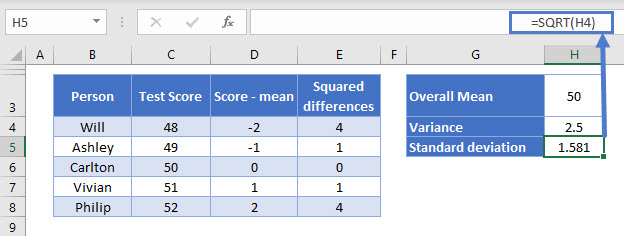
We get 1.581.
STDEV.S does all of the above calculations for us, and returns the sample standard deviation in just one cell. So let’s see what it comes up with…
=STDEV.S(C4:C8)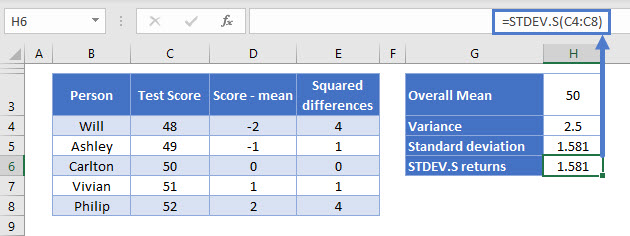
Yep, 1.581 again.
The Excel STDEV Function
Excel’s STDEV Function works in exactly the same way as STDEV.S – that is, it calculates the standard deviation for a sample of data.
You use it in the same way:
=STDEV(C4:C8)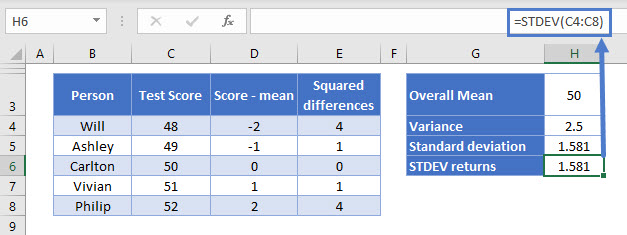
Again we get the same result.
Important note: STDEV is a “Compatibility Function”, which basically means Microsoft is getting rid of it. It still works for now, so any older spreadsheets will continue to work as normal. But in future versions of Excel, Microsoft might drop it completely, so you should use STDEV.S instead of STDEV wherever possible.
The Excel STDEVA Function
STDEVA is also used to calculate the standard deviation for a sample, but it has a couple of important differences that you need to know about:
- TRUE values are counted as 1
- FALSE values are counted as 0
- Text strings are counted as 0
Use it as follows:
=STDEVA(C4:C8)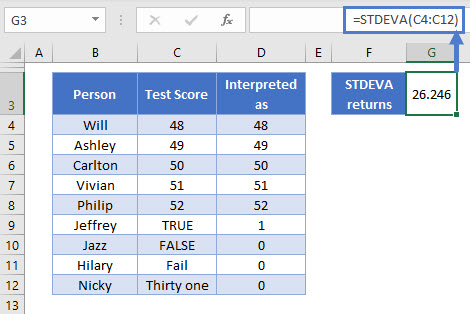
Four more friends and family members have given in their test scores. These are shown in column C, and column D indicates how STDEVA interprets this data.
Because these cells are interpreted as such low values, this creates a much wider spread among our data than we saw before, which has greatly increased the standard deviation, now at 26.246.
The Excel STDEVPA Function
STDEVPA calculates the standard deviation for a population in the same way as STDEV.P. However, it also includes Boolean values and text strings in the calculation, which are interpreted as follows:
- TRUE values are counted as 1
- FALSE values are counted as 0
- Text strings are counted as 0
You use it like this:
=STDEVPA(C4:C12)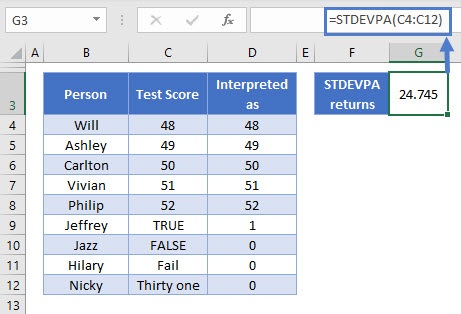
Filtering Data Before Calculating the Standard Deviation
In the real world, you won’t always have the exact data you need in a nice tidy table. Often, you’ll have a large spreadsheet full of data, which you’ll need to filter before you calculate the standard deviation.
You can do this very easily with Excel’s database functions: DSTDEV (for samples) and DSTDEVP (for populations).
These functions enable you to create a criteria table, in which you can define all the filters you need. The functions apply these filters behind-the-scenes before returning the standard deviation. This way you don’t need to touch an Autofilter or pull data out into a separate sheet – DSTDEV and SDTDEVP can do all that for you.
Learn more on the main page for the Excel DSTDEV and DSTDEVP Functions<<link>>.
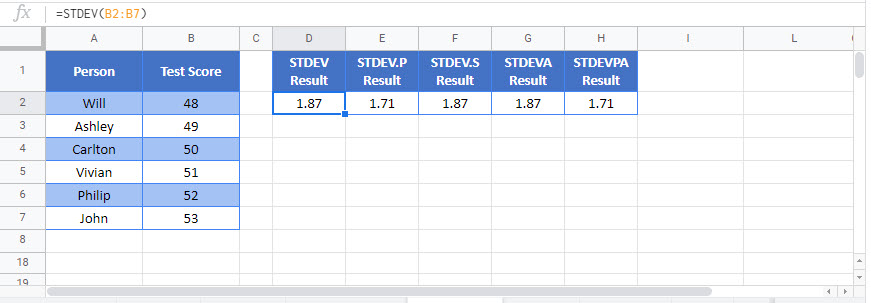
STANDARD DEVIATION Function in Google Sheets
The STANDARD DEVIATION Function works exactly the same in Google Sheets as in Excel: