VARIANCE – Excel & Google Sheets
Written by
Reviewed by
This Tutorial demonstrates how to use the Excel VARIANCE Function in Excel to estimate variance based on a given sample.
VARIANCE Function Overview
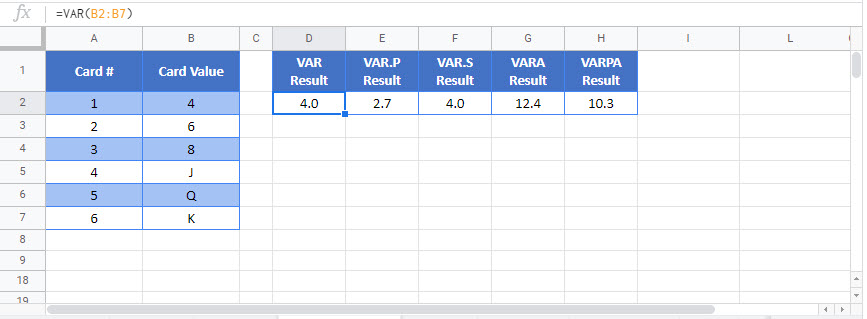
The VARIANCE Function Calculates the estimate variance based on a given sample.
To use the VARIANCE Excel Worksheet Function, select a cell and type:
![]()
(Notice how the formula inputs appear)
VARIANCE function Syntax and inputs:
=VAR(number1,[number2], …)numbers– Values to get Variance
How to Calculate the Variance in Excel
The variance tells you how spread out the values in a data set are from the mean. Mathematically speaking, the variance is the average of the squared difference of each score from the mean (but we’ll get to that shortly).
Excel gives you a number of functions to calculate the variance – VAR.S, VAR.P, VARA, VARPA, and two older functions, VAR and VARP.
Before we dig in to these functions and learn how to use them, let’s talk about the variance and how it’s calculated.
What is the Variance?
When analyzing data, a common first step is to calculate the mean. This is of course a useful statistic to calculate, but it doesn’t give you the full picture of what’s going on with your data.
Take the following data set, which might be a group of test results scored out of 100:
48,49,50,51,52The mean of this range is 50 (sum the numbers and divide by n, where n is the number of values).
Next, take the following set of test results:
10,25,50,75,90The mean of this range is also 50 – but obviously we’ve got two very different data ranges here.
By itself, the mean can’t tell you anything about how spread out the scores are. It doesn’t tell you if the values are all bunched up like in the first examples, or wide apart like the second. The variance can help you learn this.
The variance is also used as a base point for a range of more complex statistical procedures.
How the Variance is Calculated
Let’s work through a basic example, and calculate the variance by hand. This way, you’ll know what’s going on behind-the-scenes when you actually start putting Excel’s variance functions into action.
Say we have a data set representing three playing cards, a 4, a 6, and 8.
To calculate the variance, you work through this process:
1) Calculate the Mean
First, we calculate the mean. We know our data range is 4, 6, 8, so the mean is going to be:
(6 + 4 + 8) / 3 = 6I’ve confirmed this below with the Excel AVERAGE Function<<link>>:
=AVERAGE(C4:C6)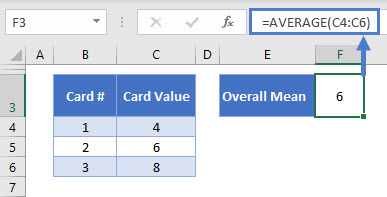
2) Subtract the Mean from Each Value in the Data Set
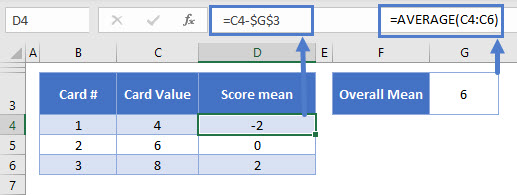
Next, we subtract the mean from each of our values.
I’ve done this with the following formula:
=C4-$H$4The mean is stored in H4, so I just subtract that from each value in the table. The dollar signs here just “lock” that cell reference to H4, so that when I copy it down the column, it stays the same.
The results:
We’ve got:
4 – 6 = -2
6 – 6 = 0
8 – 6 = 2
We need to get the average of these differences from the mean, but the mean of these three values, is zero! So we need to emphasize the differences, which we do by squaring them.
3) Square the Differences
Let’s add a new column, and square the numbers in the column D:
=D4*D4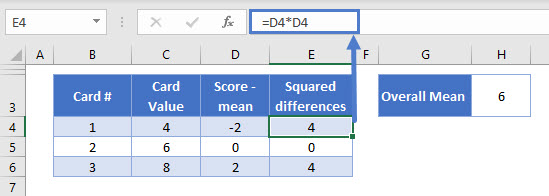
Okay, that’s better. Now that the differences don’t average out to zero, we can calculate the variance.
4) Calculate the Average of the Squared Differences
Here we meet a fork in the road. There are two ways to calculate the variance, and the one you use depends on the type of data you have.
- If you are using population data, you simply take the mean as normal (sum up the values, and divide by n)
- If you are using sample data, you sum the values, and divide by n-1
Population data means you have totality of the data you need, for example, if you want the average age of teachers in a particular school, and you have the age data for every single teacher at that school, you have population data.
Sample data means you don’t have all your data, just a sample taken from a larger population. So if you want the average age of teachers in the whole country, and you only have data on teachers at one school, you have sample data.
In our example, we have population data. We’re only interested in our three cards – that’s the population, and we haven’t taken a sample from them. So we can just take the average of the squared differences in the normal way:
=AVERAGE(E4:E8)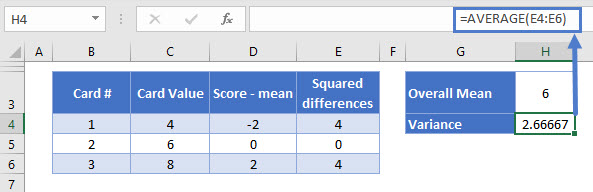
So the variance of our population is 2.666.
If this was sample data (perhaps we’d pulled these three cards out of a larger set), we’d work out the average as follows:
Sample variance = (4 + 0 + 4) / (3 – 1)Or:
Sample variance = 8 / 2 = 4Why Divide by n-1 With Sample Data, Instead of Just n?
The short answer to this question is “Because it gives the right answer”. But I imagine you’ll want a little more than that! This is a complex topic so I’ll just give a brief overview here.
Think of it like this: if you take a sample of data from a population, those values will tend to be closer to the mean of the sample than they are to the mean of the population.
This means if you just divide by n, you’ll be underestimating the population variance a little. Dividing by n-1 corrects for this a little.
With our set of three cards, we’re in a good place to test this theory. Because there are only three cards, there is a small number of samples we can possibly take.
Let’s take samples of two cards. We’ll pick one card, put it back, shuffle, and then pick another card. That means there are nine combinations of two cards we can pick.
With only nine possible samples, we can calculate every possible sample variance using both methods (divide by n, and divide by n-1), take the average of them, and see which one gives us the right answer.
In the table below, I’ve laid everything out. Each row of the table is a different sample, and columns B and C show the two cards that were picked in each sample. Then I’ve added two more columns: one where I calculated the variance of that sample of two cards by dividing by n, and another where I divided by n – 1.
Take a look:
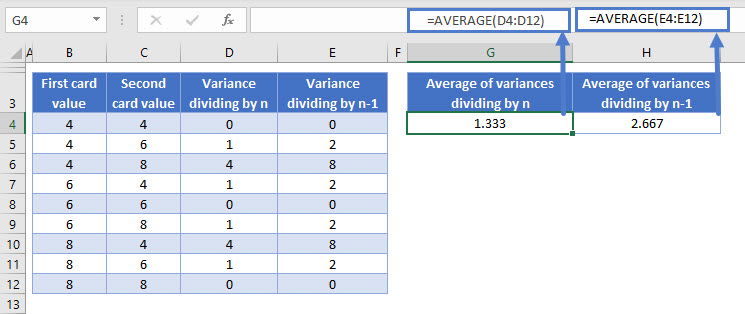
To the right of the table, I’ve shown the averages of columns D and E.
The average of column D, when dividing by n, gives us a variance of 1.333.
The average of column E, when dividing by n-1, gives us a variance of 2.666.
We already know from our previous example that the variance of the population is 2.666. So dividing by n-1 when using sample data gives us more accurate estimations.
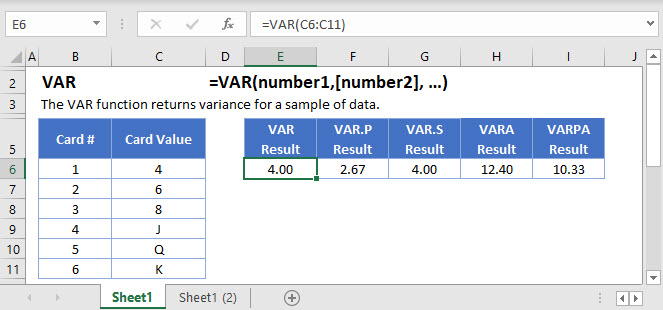
The Excel Functions to Calculate the Variance
Now that you’ve seen an example of how the variance is calculated, let’s move on to the Excel functions.
You have several options here:
- P returns the variance for population data (using the divide by n method)
- S returns the variance for sample data (divides by n-1)
- VAR is an older function that works in exactly the same way as VAR.S
- VARA is the same as VAR.S, except that it includes text cells and Boolean values
- VARPA is the same as VAR.P, except that it includes text cells and Boolean values
Let’s go through these one-by-one.
The Excel VAR.P Function
VAR.P calculates the variance for population data (using the divide by n method). Use it like this:
=VAR.P(C4:C6)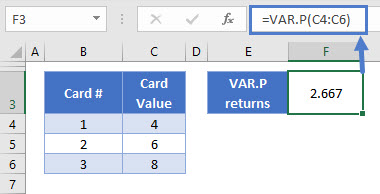
You only define one argument in VAR.P: the data range for which you want to calculate the variance. In our case here, that’s the card values in C4:C6.
As you see above VAR.P returns 2.666 for our set of three cards. This is the same value we calculated by hand earlier.
Note that VAR.P completely ignores cells containing text or Boolean (TRUE/FALSE) values. If you need to include these, use VARPA instead.
The Excel VAR.S Function
VAR.S calculates the variance for sample data (dividing by n-1). You use it like this:
=VAR.S(C4:C6)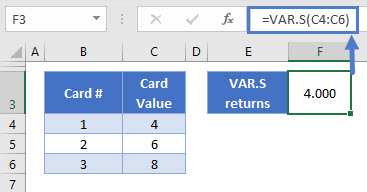
Again, there’s only one argument – your data range.
In this case VAR.S returns 4. We got the same figure in step 4 when we did the manual calculation above.
VAR.S completely ignores cells containing text or Boolean (TRUE/FALSE) values. If you need to include these, use VARA instead.
The Excel VAR Function
VAR is completely equivalent to VAR.S: it calculates the variances for sample data (using the n-1 method). Here’s how to use it:
=VAR(C4:C6)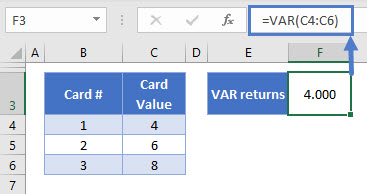
VAR is a “compatibility function”. This means Microsoft is in the process of removing this function from Excel. At the moment it is still available for use, but you should use VAR.S instead, so that your spreadsheets remain compatible with future versions of Excel.
The Excel VARA Function
VARA also returns the variance of sample data, but it has some key differences to VAR and VAR.S. Namely, it includes Boolean and text values in its calculation:
- TRUE values are counted as 1
- FALSE values are counted as 0
- Text strings are counted as 0
Here’s how you use it:
=VARA(C4:C11)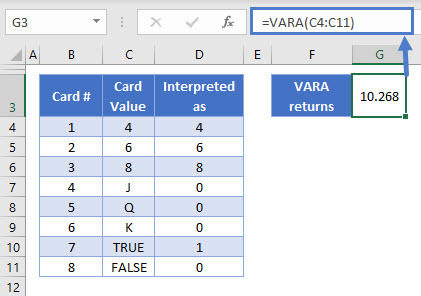
We’ve added five more rows to the table: J, Q, K, TRUE, and FALSE. Column D shows how VARA interprets these values.
Because we have a new batch of low values in our table now, the variance has increased to 10.268.
The Excel VARPA Function
VARPA calculates the variance for population data. It is similar to VAR.P, except that it also includes Boolean values and text strings in the calculation:
- TRUE values are counted as 1
- FALSE values are counted as 0
- Text strings are counted as 0
You use it like this:
=VARPA(C4:C12)
We’ve added five more rows to the table: J, Q, K, TRUE, and FALSE. Column D shows how VARPA interprets these values.
As a result of adding this group of lower values to the data, the variance has increased to 8.984.
VARIANCE Function in Google Sheets
The CORREL Function works exactly the same in Google Sheets as in Excel: