Use Scenario Manager to Calculate Revenue in Excel
Written by
Reviewed by
Last updated on June 27, 2023
This tutorial demonstrates how to use Excel’s Scenario Manager to calculate revenue.
Scenario Manager is one of Excel’s “what-if” tools. It can be used to show different figures for forecasting or budgeting.
Create a Scenario
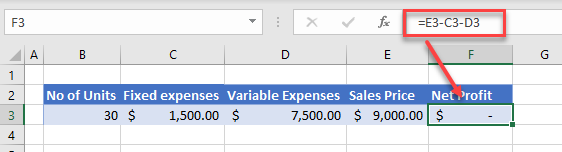
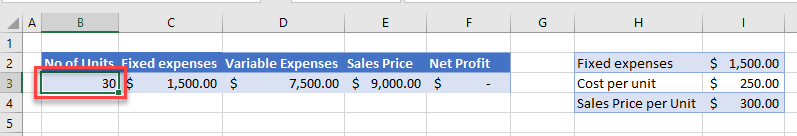
- First, create a worksheet where the calculated cell (i.e., Net Profit) changes according to values you enter into the worksheet. In the example below, the net profit changes according to how many units you can sell.
- Then, select the cell in the worksheet which you wish to change based on the figure you are going to enter into the Scenario Manager.
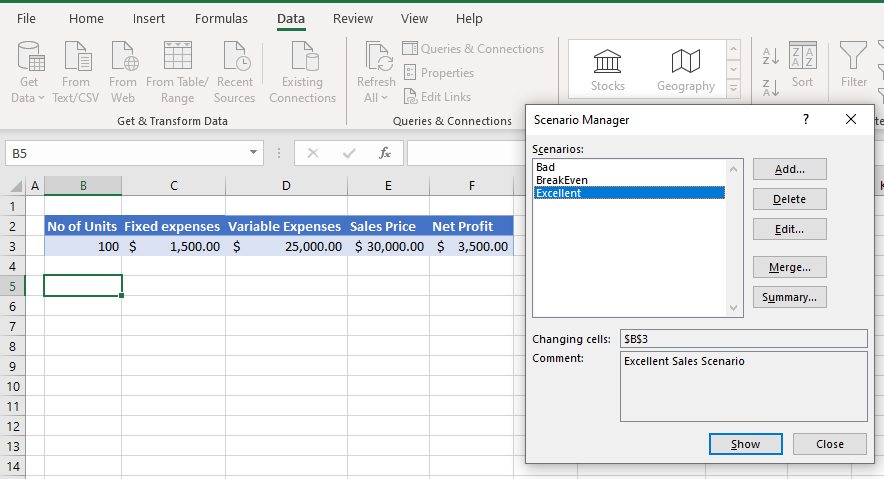
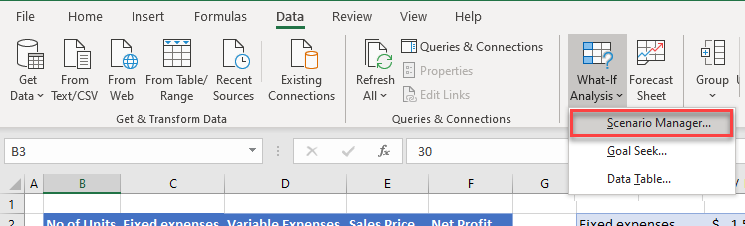
- In the Ribbon, go to Data > Forecast > What-If Analysis > Scenario Manager.
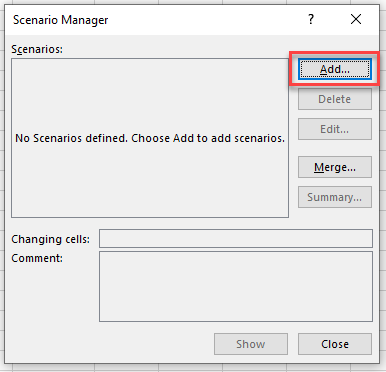
- Click Add… to create a new scenario.
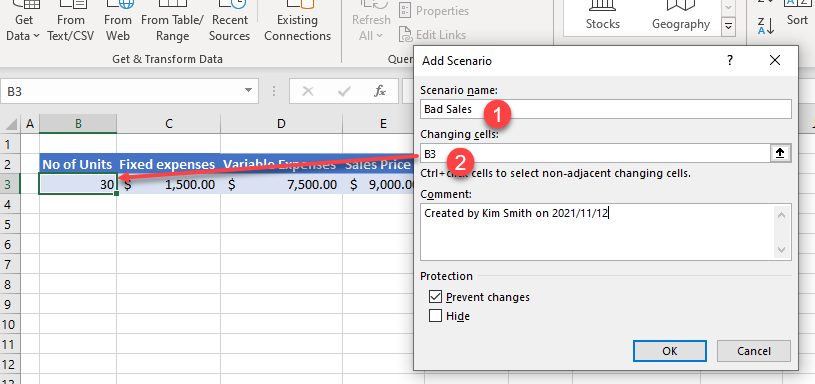
- Type in a name for the scenario. Then select the cell you want to change the value of to adjust the result (here, Net Profit in F3) of the scenario, and then click OK.
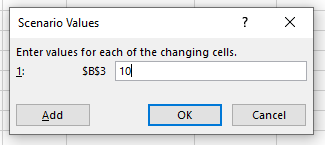
- Type in the value to go in B3 and click OK.
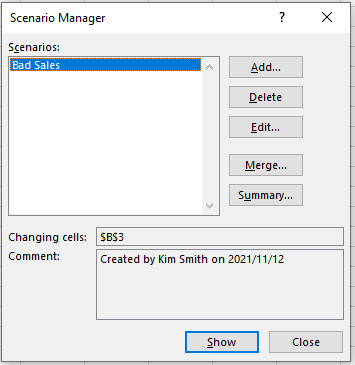
- A scenario is added to the Scenario Manager.
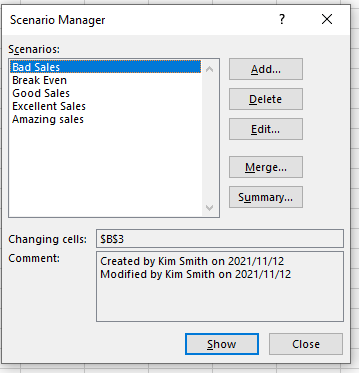
- You can now continue to add as many different scenarios as you like by changing the value of B3 in each scenario.
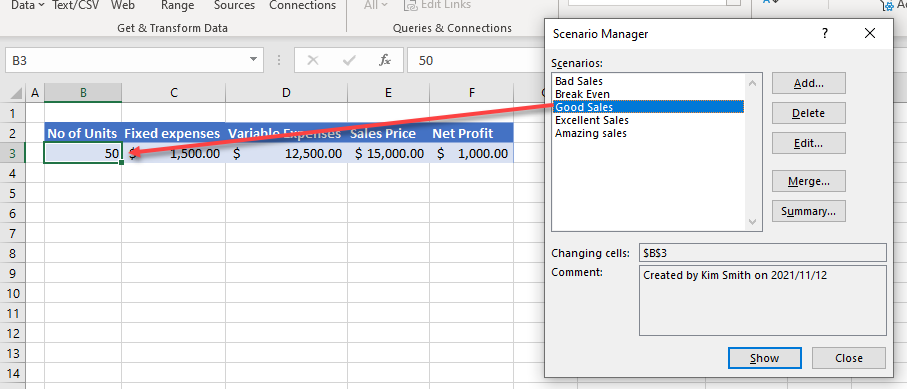
- To show a particular scenario, click on that scenario’s name, and then click Show.
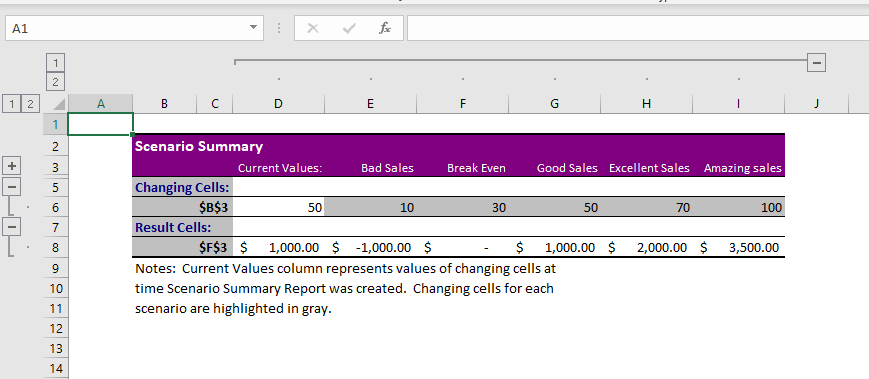
Scenario Summary
Once you have created multiple scenarios, you may wish to see them summarized either in a pivot table format or a summary sheet.
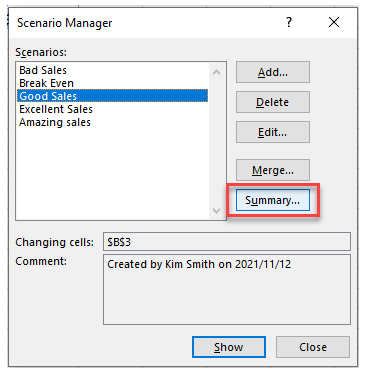
- In the Scenario Manager, click Summary…
- Choose Scenario summary for the Report type. In the Result cells field, select the Net Profit cell (F3).
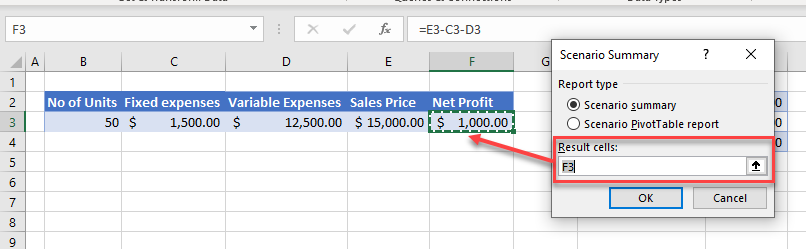
- Click OK to create a summary sheet.
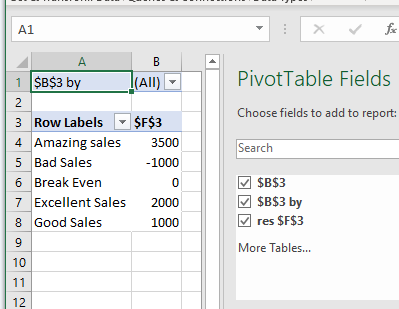
- Alternatively, you could have chosen the Scenario PivotTable report to create a pivot table.
Tip: Try using some shortcuts when you’re working with pivot tables.