Do a Sensitivity / What-If Analysis in Excel
Written by
Reviewed by
This tutorial demonstrates how to do a sensitivity analysis in Excel.
A sensitivity analysis involves entering a variety of financial scenarios to see which one is the most economically viable. In Excel, you can use single- or double-input data tables for your analysis.
Single-Input Data Tables
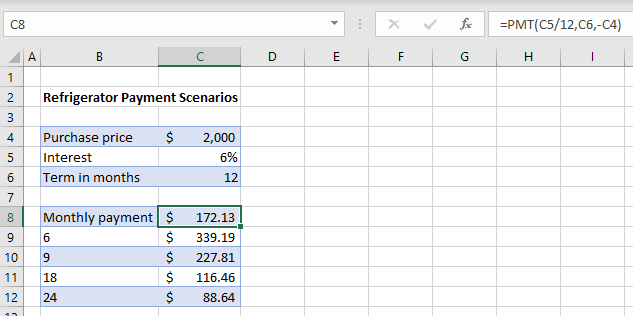
For a single-input data table, you change one variable in a table to see the results, known as a What-If Analysis. For example, take a loan where the amount is $2,000, the interest rate is 6%, and the payments are spread out over 12 months. The monthly payment amount is calculated in cell C8 using the PMT Function:
=PMT(C5/12, C6, -C4)
You can calculate hypothetical payment amounts – based on a constant rate and variable terms (6, 9, 18, and 24 months) – to see which scenario is best for you.
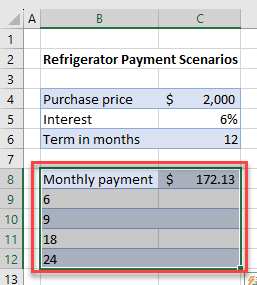
- To run a What-If Analysis, highlight the partially blank data table –with rows for each hypothetical term (in months).
- In the Ribbon, go to Data > What-If Analysis > Data Table…
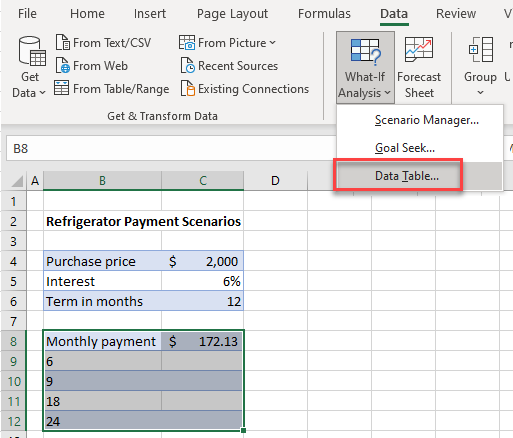
- You want to fill the table in, replacing the original term with the “what-if” term and show corresponding payments. So, for the Column input cell, set C6 (the original 12-month term).
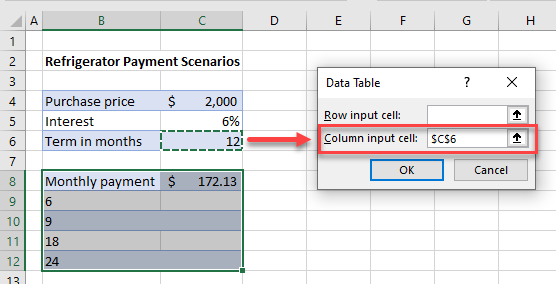
- This changes the formula in cell C8 to pick up each value in Column B (i.e., 6, 9, 18, and 24) in place of the value 12 in C6. Click OK.
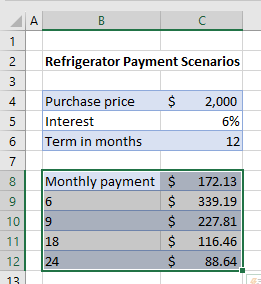
- The table is filled in with the new scenarios to show you how much the monthly payment would be should the term of the loan be adjusted.
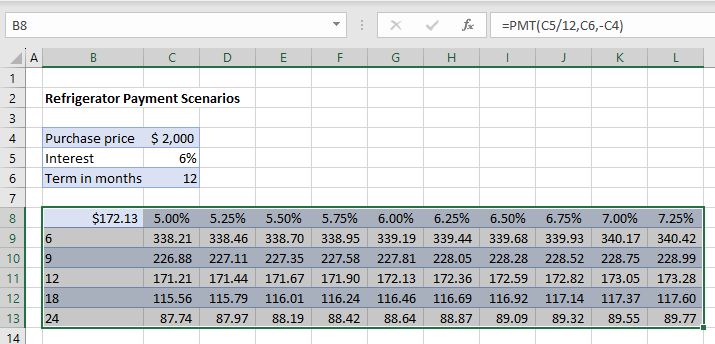
Double-Input Data Tables
A double-input data table lets you adjust two variables. So, as well as changing the term in months, you can change the interest rate applied to the loan. You can therefore have both row and column input cells instead of just one or the other.
Consider the worksheet below.
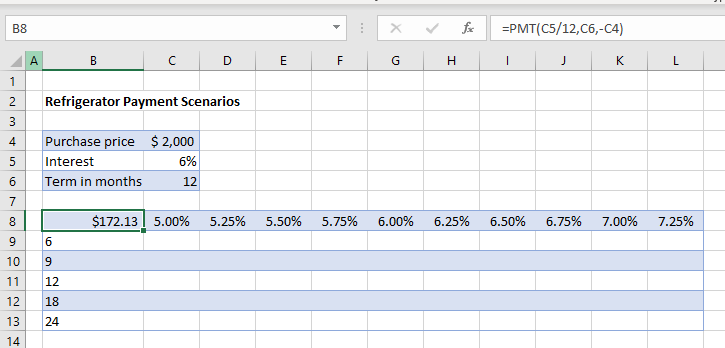
In this scenario, both the term and the interest rate are going to be variables. In the PMT formula held in C8, the value in C6 is replaced by the row values in Rows 9 to 12; and the value in C4 is replaced by the column values in Columns C to L.
- First, highlight the data table.
- Then in the Ribbon, go to Data > What-If Analysis > Data Table…
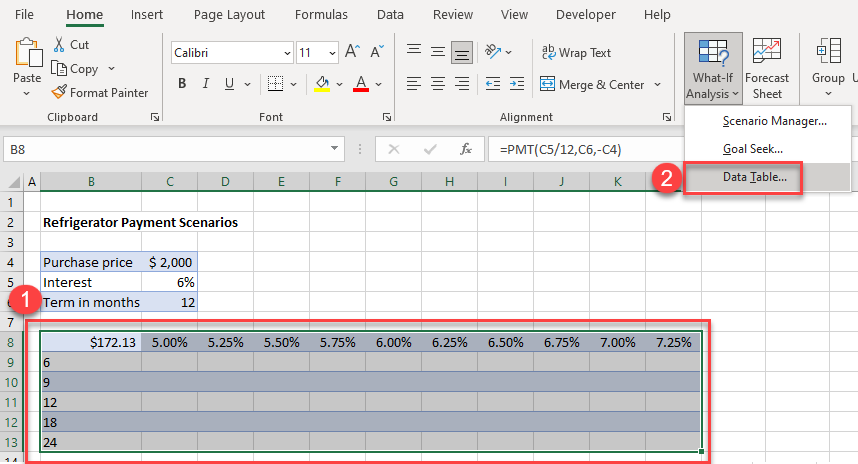
- For the Row input cell, select C5 (the interest rate), and in the Column input cell, select C6 (the term).
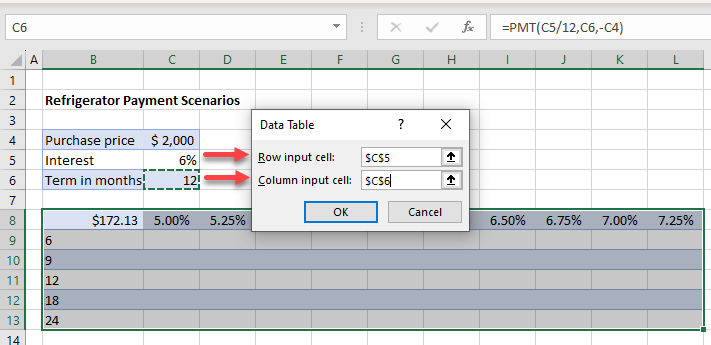
- Click OK. Excel fills in the scenario table, as pictured below.