Chi-Square Goodness of Fit (GoF) Test – Excel and Google Sheets
Written by
Reviewed by
Chi-Square () goodness of fit test is a statistical test used to determine whether observed data from a sample matches the theoretical (expected) data from the population.
Conditions for Chi-Square Goodness of Fit Test
- The data points should be frequencies or counts and not percentages or other forms of data.
- The categories of the variables should be mutually exclusive. That is, each data point can only belong to one category.
- The subject of study must be independent.
- The Expected Values should be at least 5.
How to Perform Chi-Square Goodness of Fit Tests in Excel
There are two ways to perform Chi-Square Tests in Excel:
- The TEST Function, and
- The INV.RT Function.
CHISQ.TEST Function
The CHISQ.TEST Function returns the p-value of the set of data which is used to make a conclusion whether the sample data matches the expected values.
If the p-value is less than the significant level, it means that the sample data does not match the expected data from the population.
CHISQ.TEST Function Syntax
=CHISQ.TEST(actual range, expected range)
How to Use CHISQ.TEST Function
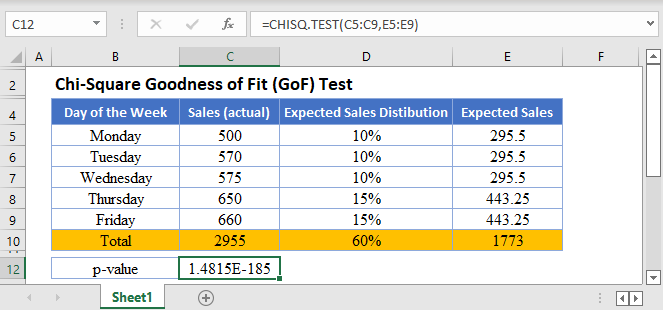
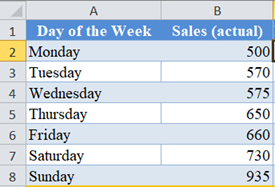
Background: A grocery store owner believes that Saturdays and Sundays each contribute 20% of his weekly sales, and Thursdays and Fridays contribute 15% each. The rest of the days of the week have approximately equal amounts of sales. To verify his claim, he obtained the sales figures of the distribution of sales in a certain week. The figures are displayed below. Test at a 5% significant level whether the week’s figures support his claim.
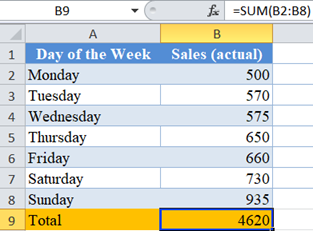
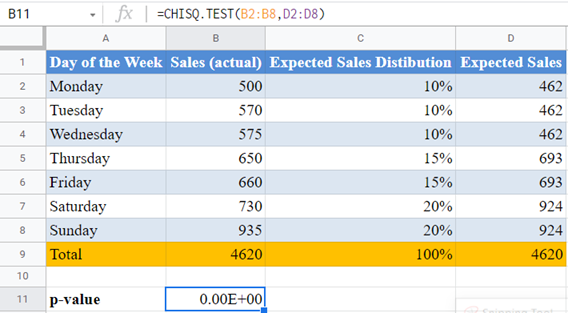
First, calculate the total actual Sales using the SUM Function.
Next, write out the expected distribution of sales (in percent) of the days of the week.
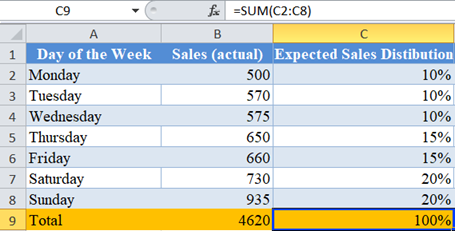
Note: The distribution of Sales for the days of the week must equal 100%. Since Saturday and Sunday are 20% each, and Thursday and Friday are 15% each, making a total of 70% for the four days. Then, since the rest of the days have approximately equal sales, this means, that the rest of the days (three days) will share the remaining 30% equally, which gives 10% each.
Next, calculate the expected sales for each day by multiplying the Expected Sales Distribution column to the Total actual sales as shown below.
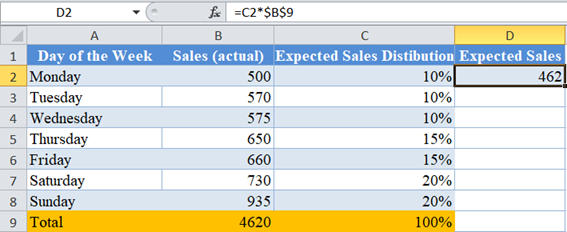
Note: I used absolute referencing so that I can easily autofill without changing the cell value for the Total Expected Sales Distribution.
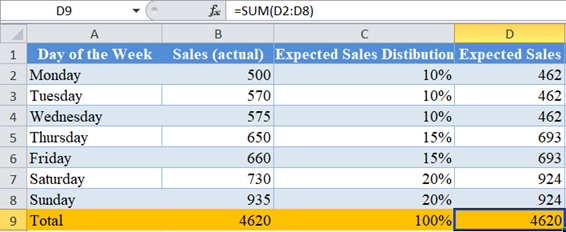
Do the same as above for the rest of the days of the week and calculate the total.
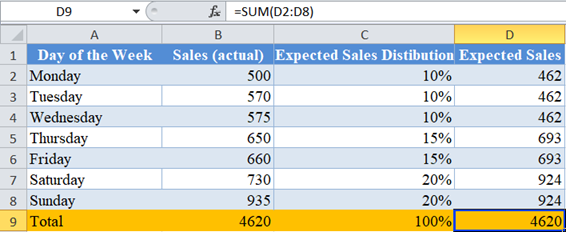
Notice that the Total Actual Sales is equal to the Total Expected Sales. This is always the case if you performed your calculations accurately.
Now, perform the Chi-Square Test (Calculate the p-value) using the CHISQ.TEST Function.
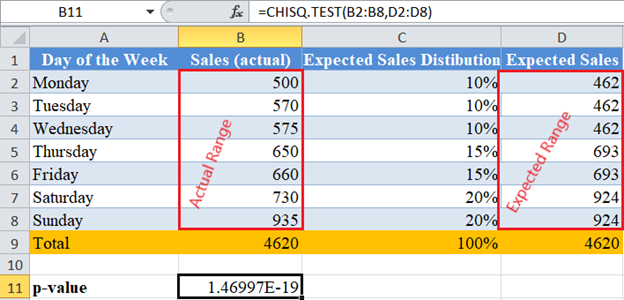
The p-value here is which is a very small number and is less than our significant level of 5% or 0.05. Therefore, we conclude that the Sales figures do not match the expected Sales figures based on the grocery owner’s claim.
CHISQ.INV.RT Function
The CHISQ.INV.RT Function returns the inverse of the right-tailed probability (the critical value) of the chi-squared distribution which is used to make a conclusion whether the sample data matches the expected values.
If the observed Chi-Square value is greater than the critical value, it means that the sample data does not match the expected data from the population.
CHISQ.INV.RT Function Syntax
=CHISQ.INV.RT(probability (significant level), degree of freedom)How to Use CHISQ.INV.RT Function
Background: A grocery store owner believes that Saturdays and Sundays each contribute 20% of his weekly sales, and Thursdays and Fridays contribute 15% each. The rest of the days of the week have approximately equal amounts of sales. To verify his claim, he obtained the sales figures of the distribution of sales in a certain week. The figures are displayed below. Test at a 5% significant level whether the week’s figures support his claim.

Follow the steps listed earlier to calculate up to the Expected Sales for each day of the week.
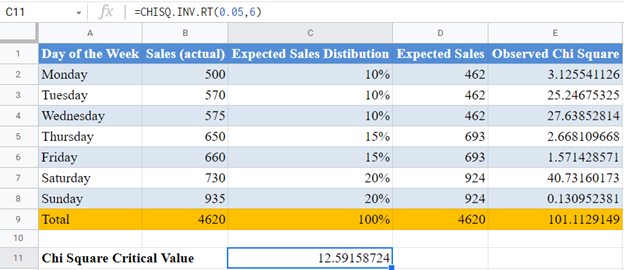
Next, calculate the observed Chi-Square value for each cell by dividing the square of the difference between each actual value and expected value by the expected value and adding up all the results as shown below.
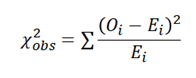
where is the observed value for each cell, and is the expected value for each cell.
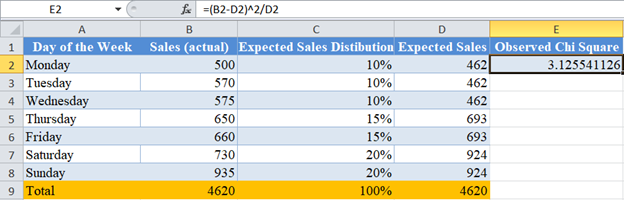
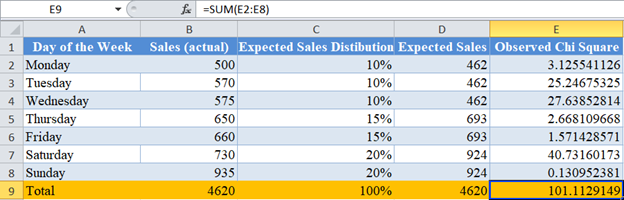
Complete the rest of the rows and calculate the total for the column.
Now, calculate the Chi-Square critical value using the CHISQ.INV.RT Function.
The significance level serves as the probability. Here, the significance level is 0.05. The degree of freedom is the number of observations -1 , (k-1). Here, there are seven observations (seven days of the week), so, degree of freedom is 7 – 1 = 6.
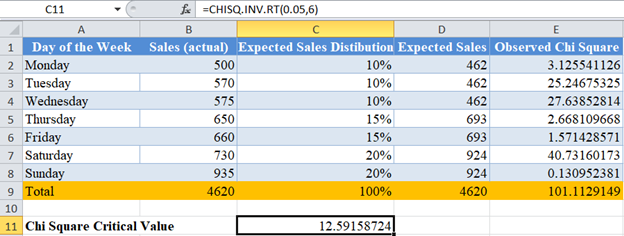
Here, the observed Chi-Square is 101.1129149 and the critical value is 12.59158724. Clearly, the observed Chi-Square is greater than the critical value; hence, we conclude that the Sales figures do not match the expected Sales figures based on the grocery owner’s claim.
Chi-Square Goodness of Fit Test in Google Sheets
Chi-Square Goodness of Fit test can be calculated using similar methods in Google Sheets.
You can use the CHISQ.TEST Function the same way as in Excel.
Note: CHISQ.TEST and CHITEST Functions perform exactly the same function. So, you can use any of them and achieve the same result. Also note that Google Sheets has a maximum digits limit of 15 digits, and since the p-value, as obtained from Excel is , which has zero decimal digits of more than 15 digits. Hence, Google Sheets approximated its result to zero.
Or use the CHISQ.INV.RT Function:
Common Errors – CHISQ.TEST & CHISQ.INV.RT Functions
Some of the errors you may encounter when using the CHISQ.TEST and CHISQ.INV.RT Functions.
- TEST Function returns #N/A error value when:
- The number of data points for the actual range is different from the number of data points (cells) for the expected range.
- If there is only one data point (one cell)
- INV.RT Function returns #VALUE error value when either the probability or the degree of freedom arguments is not a number.
- INV.RT Function returns #NUM error value when:
- The probability is greater than 1 or less than 0.
- The degree of freedom is less than 1 or greater than .
- INV.RT Function expects the degree of freedom argument to be an integer, when not an integer, the function returns the value for the integer part. That is, CHISQ.INV.RT Function will return the same value for the degrees of freedom values of 3, 3.2, 3.8, etc.
