Confidence Intervals in Excel & Google Sheets
Written by
Reviewed by
This tutorial will demonstrate how to create confidence intervals in Excel and Google Sheets.
Confidence Intervals (CIs) provide the range of values where the actual mean (the average) for a population should fall. It is usually displayed as:![]() This means that at a certain level of confidence, we expect that the actual population mean will fall within 6 units below and above 22.
This means that at a certain level of confidence, we expect that the actual population mean will fall within 6 units below and above 22.
Confidence Intervals are calculated based on a sample mean![]() from the population, using a “level of confidence”. For example, a 99% confidence level gives more certainty that the actual mean will fall within the confidence interval than a 90% confidence level.
from the population, using a “level of confidence”. For example, a 99% confidence level gives more certainty that the actual mean will fall within the confidence interval than a 90% confidence level.
The margin of error (E) gives you how far above and below the sample mean the upper and the lower bounds of the confidence interval respectively lie. After calculating the margin of error, the confidence interval is presented as the sample mean (average) and the margin of error with a plus-minus (±) sign in-between them:
![]()
How to Calculate Confidence Intervals in Excel
There are three ways to calculate confidence intervals in Excel:
- The CONFIDENCE.NORM or CONFIDENCE.T Functions.
- The Descriptive Statistics option of the Data Analysis button on the Data
- Manually calculating the Confidence Interval.
CONFIDENCE Functions
The CONFIDENCE.NORM and CONFIDENCE.T Functions return the margin of error used to calculate the confidence interval.
When to use CONFIDENCE.NORM vs. CONFIDENCE.T
- The .NORM function is used when the population standard deviation is known.
- The .T function is used when the population standard deviation is unknown.
However, according to the Central Limit Theorem (CLT), a powerful statistics theorem, if the sample is sufficiently large (usually 30 or above), the sample standard deviation can be used to approximate the population standard deviation.
In other words, use the CONFIDENCE.NORM function when the population standard deviation is known, or when the population standard deviation is unknown, but the sample size is 30 or above.
Confidence Functions Syntax
=CONFIDENCE.NORM(Alpha, standard deviation, sample size)=CONFIDENCE.T(Alpha, standard deviation, sample size)Alpha is the level of significance which is obtained by subtracting the confidence level from 1. For example, suppose you want to calculate the 95% confidence interval of the mean, the significance level (alpha) corresponds to 1-0.95 = 0.05 . The most popular confidence levels usually used to calculate confidence intervals are 90%, 95%, and 99%.
CONFIDENCE.NORM Example
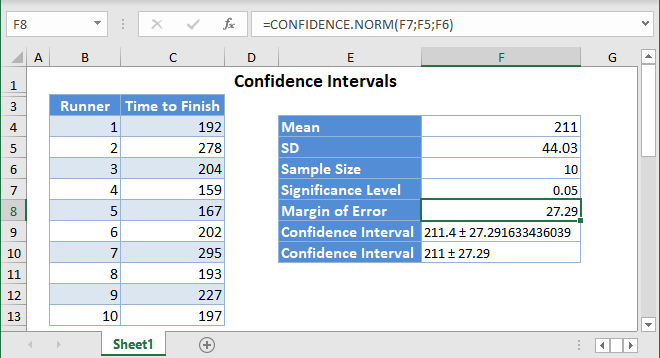
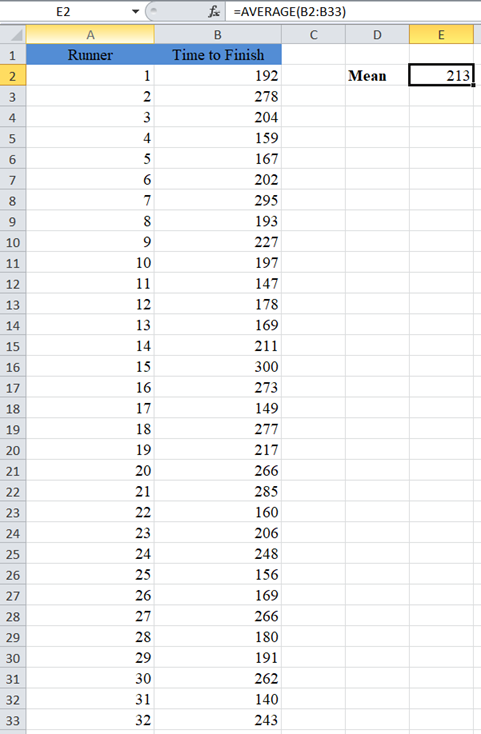
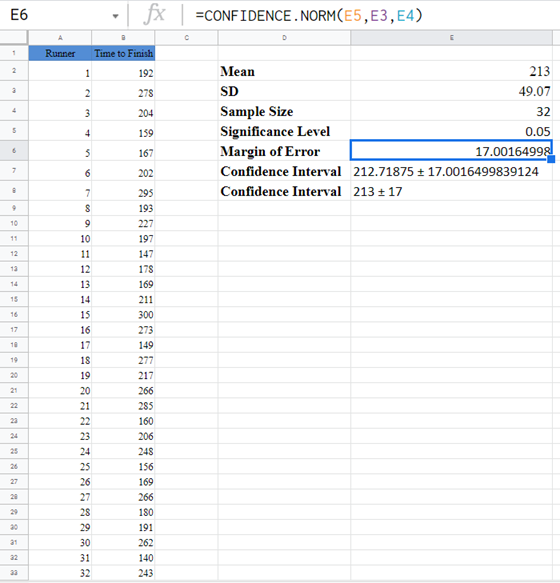
Background: The time, in minutes, to finish a marathon is assumed to be normally distributed. A random sample of marathon runners were monitored and the time it took them to finish a marathon is presented below. Let us compute a 95% confidence interval for the mean (average) time it takes all runners to run a marathon.
First, calculate the sample mean (average) of the sample using the AVERAGE Function.
Next, calculate the Standard Deviation (SD) of the sample using the STDEV.S Function.
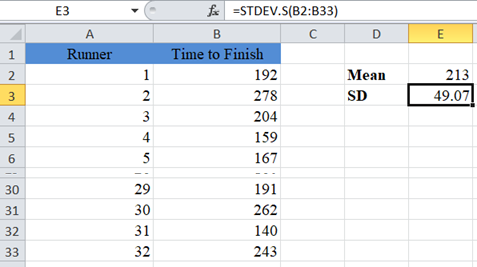
Note: The STDEV.S Function is used to calculate the sample standard deviation while STDEV.P is used to calculate the population standard deviation. When calculating confidence intervals, always use the STDEV.S Function to calculate the standard deviation of the sample.
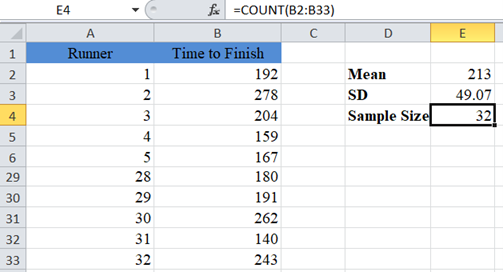
Next, calculate the sample size using the COUNT Function.
To calculate a 95% confidence interval, the alpha (significant level) is 1-0.95 = 0.05.
Now, calculate the Margin of Error using the CONFIDENCE.NORM Function.
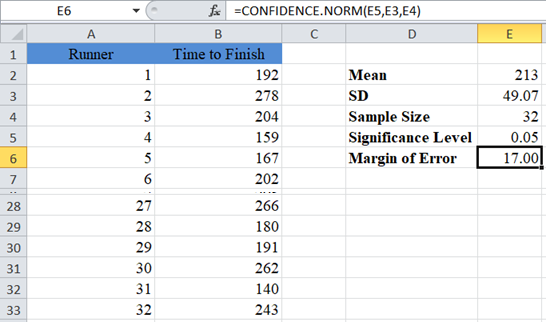
Note: we are using the CONFIDENCE.NORM Function here because, according to the Central Limit Theorem (CLT), we can approximate the population standard deviation using the sample standard deviation if the sample size is 30 or more.
Use the CONCATENATE Function to display the confidence interval by adding and subtracting the margin of error from the mean.
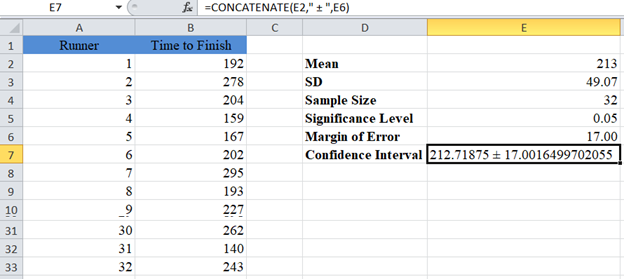
Note: The CONCATENATE Function does not round the values. So let’s add the ROUND Function to the formula to make our result easier to read.
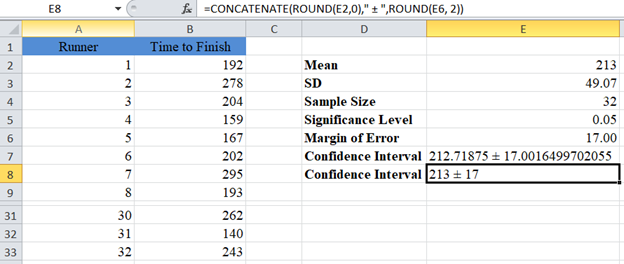
Our Confidence Interval for the population mean is 213±17 or simply (196,230) .
CONFIDENCE.T Example
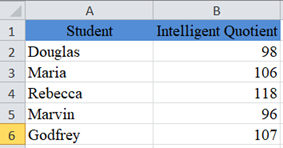
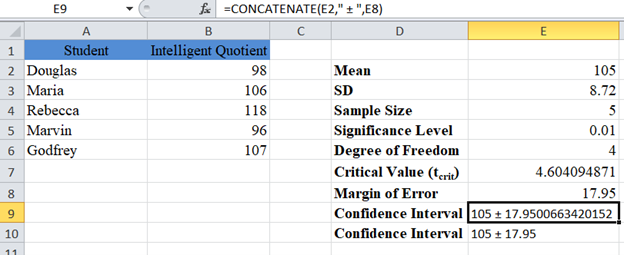
Background: The Intelligent Quotient of college students in the United States is assumed to follow a normal distribution. The intelligent quotients of a random sample of 5 US college students are as shown below. Let us compute a 99% confidence interval for the mean (average) intelligent quotient of all college students in the United States.
In this case, alpha (significant level) is 1-0.99 = 0.01.
Follow the steps in the previous example to calculate the Mean, Standard Deviation (SD), and the Sample Size.
Now, calculate the Margin of Error using the CONFIDENCE.T function in Excel.
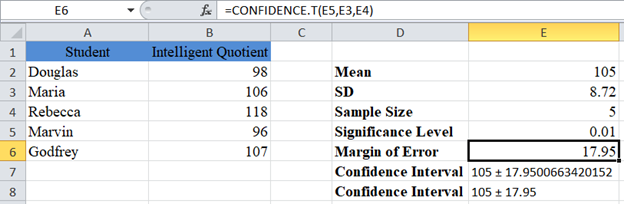
Note: we used the CONFIDENCE.T Function here because we do not know the population standard deviation, and the sample size is small (less than 30).
The Confidence Interval for the population mean is 105±17.95 or simply (87.05 , 122.95).
Calculate Confidence Intervals Using Descriptive Statistics
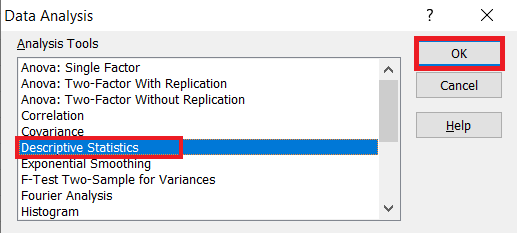
Another alternative method of calculating Confidence Intervals in Excel is by using Descriptive Statistics feature. This feature is located in the Data Ribbon > Data Analysis.

If you don’t see the Data Analysis option, you will need to install the Data Analysis Toolpak.
In the Data Analysis window, choose Descriptive Statistics and click OK.
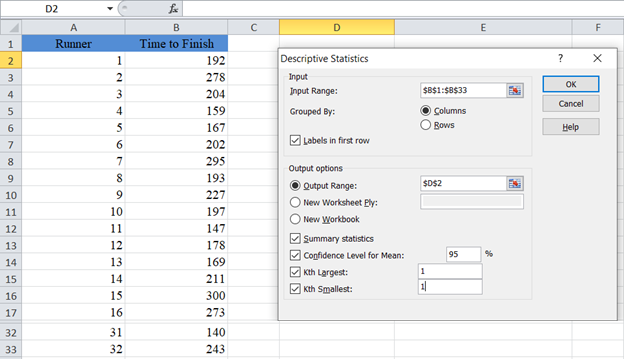
Next, you will need to configure the parameters.
- Click on “Input Range” and select the cells containing the source data.
- In the “Grouped By” section, select the “Columns” radio box.
- Select the “Labels in first row” checkbox if the selected range contains column headers as shown in the example below.
- Select the desired output option. To get the results on the same sheet, select the Output range and specify the specific reference to the cell into which to display the matrix. In our case it is $D$2
- Check the “Confidence Level for Mean” checkbox and enter the desired confidence level, for our case 95% for example 1 and 99% for example 2.
- You can also check the other checkboxes, for more descriptive statistics values for the data, including the “Summary statistics”, “Kth Largest”, and “Kth Smallest” checkboxes.
The output for the first example is as follows:
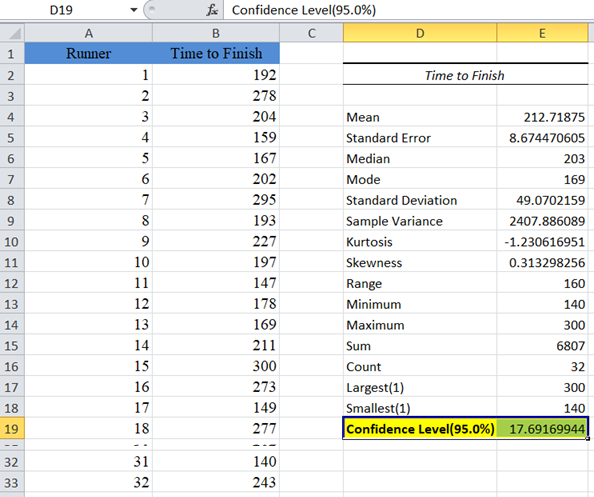
From the above result, the confidence value (margin of error) is approximately 17.69. To get the confidence interval, we then add and subtract the confidence value from the mean as shown: 213±17.69 to obtain (195.31, 230.69) as the confidence interval.
Confidence Interval Formula in Excel
You can also calculate Confidence Intervals by using the confidence interval formula directly. The formula for the 100(1-α)% confidence interval is given by:
Mean ± zcrit (or tcrit) * (Standard deviation / Square root of sample size)
zcrit (or tcrit) * (Standard deviation / Square root of sample size) is the margin of error.
- Use zcrit when the population standard deviation is known.
- Use tcrit when the population standard deviation is unknown.
- Use zcrit when the population standard deviation is unknown but the sample is 30 or above.
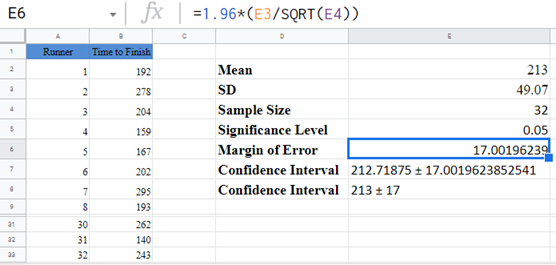
Excel does not have a special function to get the zcrit of any given confidence level. However, for tcrit, the T.INV.2T Function gives the tcrit for any given confidence level and degree of freedom. We will talk more about this function in example 2. For popular confidence levels, 90%, 95%, and 99%, the zcrit are 1.645, 1.96, and 2.576 respectively.
For example 1, we will use 1.96 as the zcrit for our 95% confidence interval. The procedure is shown below:
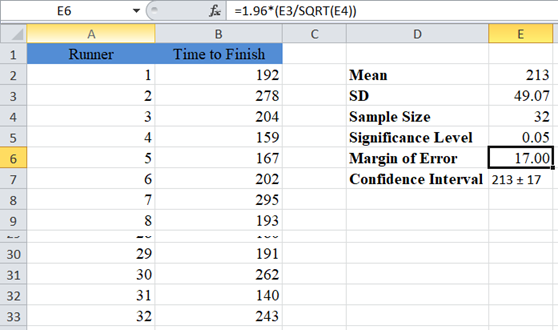
The margin of error gives 17.00, and as usual, the confidence interval is Mean ± Margin of error which is 213±17 or (213-17,213+17)=(196,230).
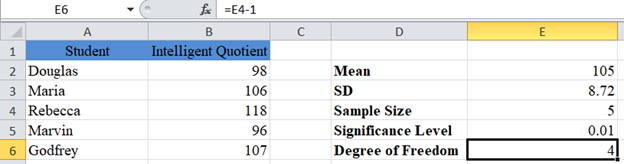
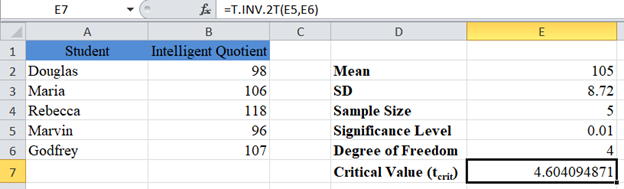
For example 2, since the population standard deviation is unknown and the sample is small, we will use the T.INV.2T function to obtain the tcrit of the 99% confidence interval. The T.INV.2T function takes two arguments: probability (alpha) and degree of freedom. When finding confidence intervals, alpha serves as the probability. The degree of freedom (df) is obtained by subtracting 1 from the sample size. So, for our case, df = 5 – 1 = 4.
So, we follow the following steps to directly calculate confidence intervals when the population standard deviation is unknown and the sample is small.
First, use the methods illustrated in the previous examples to calculate the Mean, Standard Deviation, Sample size and Significance Level. Then, obtain the degree of freedom.
Next, obtain the critical value (tcrit).
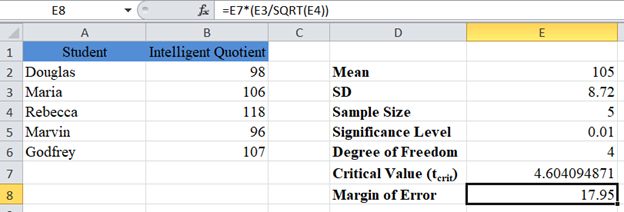
Now, calculate the margin of error.
Finally, present the confidence interval.
The margin of error gives 17.95, and as usual, the confidence interval is Mean ± Margin of Error which is 105±17.95 or (105-17.95,105+17.95)=(87.05,122.95).
Confidence Intervals in Google Sheets
Confidence Intervals can be calculated using similar methods in Google Sheets.
You can use the CONFIDENCE.NORM and CONFIDENCE.T Functions.
Or Calculate the Confidence Interval manually:
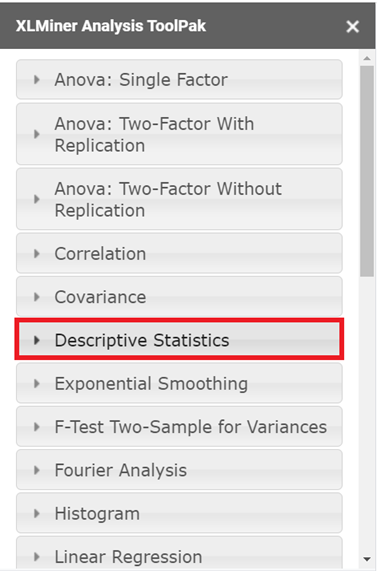
Confidence Interval – XLMiner Analysis Toolpak
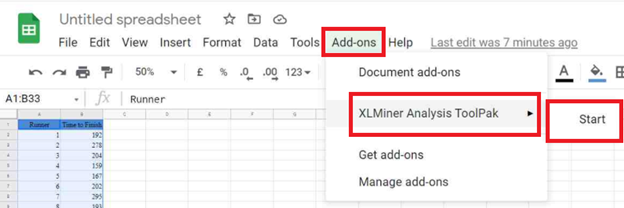
Google Sheets does not have the Data Analysis Toolpak, instead it has the XLMiner Analytis Toolpak Add-on.
After you have installed this add-on, you can find it in the Add-ons tab. Select XLMiner Analysis ToolPak and click on Start.
In the XLMiner Analysis ToolPak window, choose Descriptive Statistics.
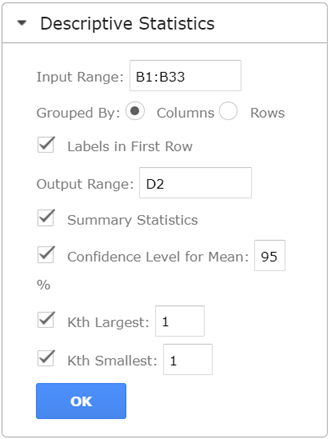
In the Descriptive Statistics option dropdown, configure the parameters as follows.
- Select the cells containing the source data and click the “Input Range” box.
- In the “Grouped By” section, select the “Columns” radio box.
- Select the “Labels in first row” checkbox if the selected range contains column headers as shown in the example below.
- Enter the desired output start cell or range in the “Output Range” box.
- Check the “Confidence Level for Mean” checkbox and enter the desired confidence level, for our case 95%.
- You can also check the other checkboxes, for more descriptive statistics values for the data, including the “Summary statistics”, “Kth Largest”, and “Kth Smallest” checkboxes.
- Then click “OK”.
The output is as follows:
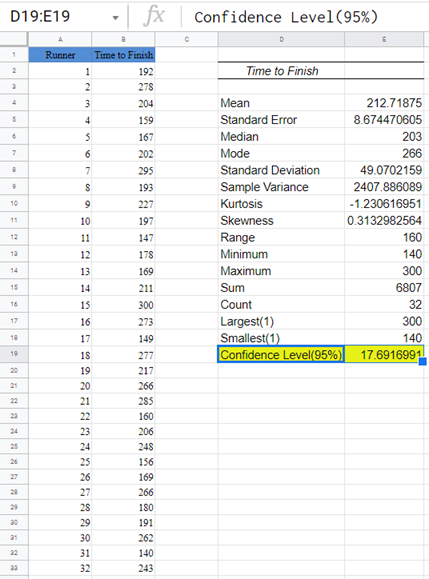
From the above result, the confidence value (margin of error) is approximately 17.69. To get the confidence interval, we then add and subtract the confidence value from the mean as shown: 213±17.69 to obtain (195.31,230.69) as the confidence interval.
