DSTDEV and DSTEVP Function Examples in Excel & Google Sheets
Written by
Reviewed by
This tutorial demonstrates how to use the DSTDEV Functions in Excel to calculate the standard deviation of sample data that match certain criteria.
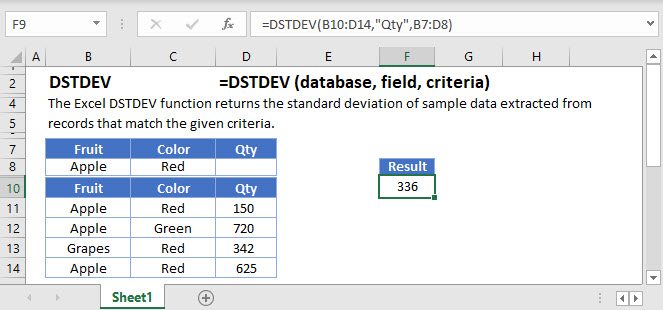
What are the DSTDEV and DSTEVP Functions?
DSTDEV and DSTDEVP are two of Excel’s database functions. They return the standard deviation of a column in a database, after first applying a range of filters to the data that you specify.
The two functions serve slightly different purposes:
- DSTDEV returns the standard deviation of a sample
- DSTDEV returns the standard deviation of the entire population
Note that in this context, “database” simply means any table or list of data in Excel, as long as it has been organized with column headers.
What is the Standard Deviation?
The standard deviation is a measure of dispersion – it tells you how spread out the values in a given range are, relative to the mean.
Is your data bunched up tightly around the mean, like the example below?
48,49,50,51,52Or is it more widely spread, like this next example?
10,25,50,75,90In both of these cases, the mean is 50. By itself, the mean doesn’t tell us everything we might need to know about the data.
The standard deviation, however, can give us an idea of this spread.
How the Standard Deviation is Calculated
The standard deviation is the square root of the variance. To get the variance, you subtract the mean from each value in the data range, square each of these differences, and then take the average of these squared differences.
There are actually two ways to calculate the standard deviation, depending on whether you have sample or population data. If you have sample data, use DSTDEV, and if you have the data for the whole population, use DSTDEVP.
For example, if you’ve given a survey to 100 of your customers, and you want to use your results to make predictions about all of your customers, you’d use DSTDEV. If you only have 100 customers, and you’ve surveyed all of them, that’s the whole population so you’d use DSTDEVP.
You can learn more about the standard deviation: How to calculate the standard deviation in Excel.
How to Use the Excel DSTDEV Function
To use the Excel DSTDEV Function, type the following:
=DSTDEV(B7:E19,"Age",B3:E4)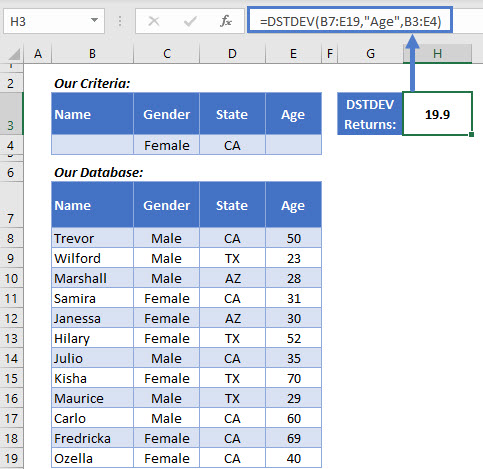
Here we have a database containing data on a group of people’s gender, state, and age. We’re calculating the standard deviation of the age column, but we’re filtering the data to just females from California.
Here’s how DSTDEV works:
- The first argument is the database – the table in B7:F19. Note: you must include the column headers in this range.
- The second argument is the column we want the standard deviation of, so “Age” in this case. You can reference columns by their name in quotations like here, or by their numerical position (putting 4 here would get the same result).
- The third argument defines the filters we want DSTDEV to apply before calculating the standard deviation. These stored in the criteria table in B3:E4.
Look at the criteria table in B3:E4. I’ve set it up with the same headers as the database and defined two criteria: a “Gender” should be “Female” and “State” should be “CA”. You don’t have to include every column header from your database in your criteria table – you can just list the ones you need.
DSTDEV returns out standard deviation: 19.9 years.
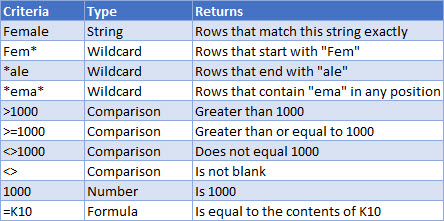
DSTDEV Criteria
You have plenty of options when defining the filters in your criteria table. Our example above just used text filters, but you can use number comparators, wildcards, and even the result of formulas. Here are a few common examples:
Multiple Criteria Rows
When you create your criteria table, you can use more than one row. DSTDEV uses “OR” logic in these cases. That is, it will include in the calculation rows that match ANY of your criteria rows.
Here’s an example:
=DSTDEV(B8:E20,"Age",B3:E5)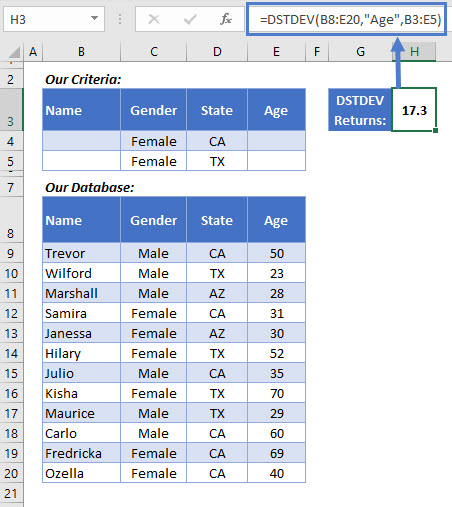
I’ve added an extra row to the criteria table, and updated the third argument in the DSTDEV function to include it.
Now the criteria are: Female and from CA, Or, Female and from TX. DSTDEV goes through each row in the database one-by-one, and if the row matches either of those criteria, it will be included in the calculation.
DSTDEV returns 17.3 years this time.
How to Use the Excel DSTDEVP Function
The Excel DSTDEVP function works in exactly the same way as the DSTDEV function, but it returns the standard deviation for population data.
Be sure that this is the appropriate function for you to use – if you’re filtering the data, then quite possibly you’ll be working with a sample, in which case you’d use DSTDEV. If your filter leaves you with an entire population that you’re interested in, you can continue with DSTDEVP.
Use it in the same way:
=DSTDEVP(B7:E19,"Age",B3:E4)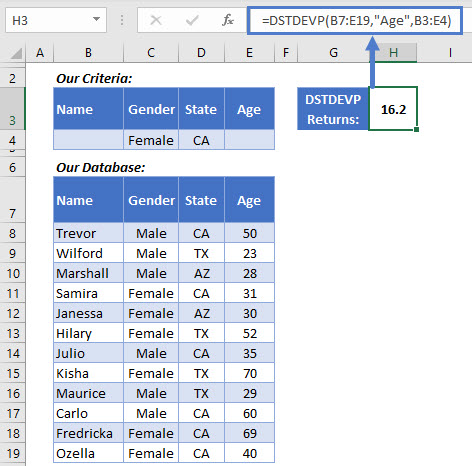
Everything works in the same way as DSTDEV – the function’s arguments are the same, and the rules regarding the criteria table apply equally.
So here, we’ve used the exact same data, applied the same criteria, and we’re getting the result from the same column. But the result is different: 16.2 years, instead of the 19.9 years we got previously with DSTDEV.
This is because the standard deviation of a population is calculated in a different way to that of a sample.
Use STDEV.S or STDEV.P When You Don’t Need to Filter Data
DSTDEV’s ability to filter data before getting the result can be extremely useful, but it’s not always needed. Sometimes you have a range of data, and just you need to know the standard deviation.
In these cases, you would use STDEV.S with sample data, and STDEV.P with population data.
The STDEV.S Function
STDEV.S is a little simpler to use. You only need to supply one argument – the cells containing your sample data:
=STDEV.S(C4:C6) 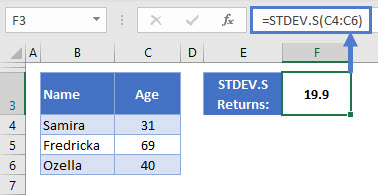
Note that you don’t include the column headers in the range this time.
So, in this example, we have the same three data points we saw in the first example, when we filtered by “Female” and “CA” – and STDEV.S has returned the same result: 19.9
The STDEV.P Function
STDEV.P works in just the same way as STDEV.S – just supply the range of cells containing your population data, and it will return the standard deviation for you.
=STDEV.P(C4:C15)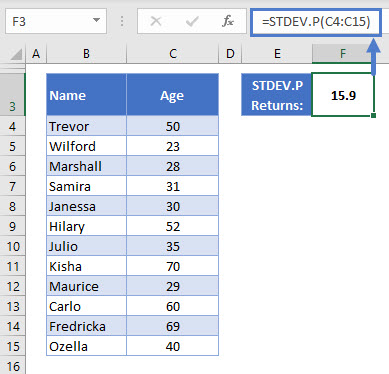
Since we’re getting the population standard deviation, I’ve included the whole data set in this one. STDEV.P returns 15.9.
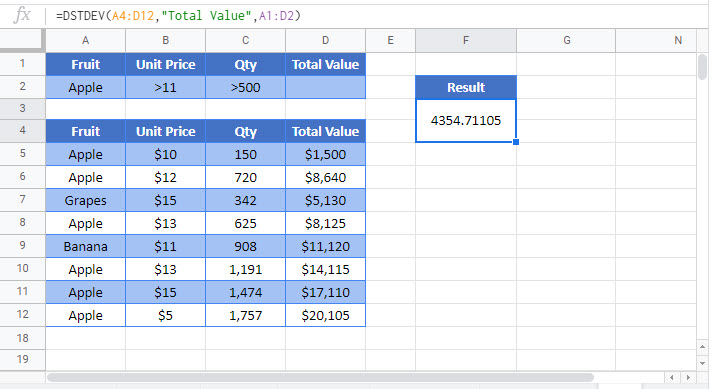
DSTDEV function in Google Sheets
The DSTDEV function works exactly the same in Google Sheets as in Excel.