LOGEST Function Examples – Excel & Google Sheets
Written by
Reviewed by
This tutorial demonstrates how to use the LOGEST Function in Excel to calculate the exponential curve.
What is LOGEST?
The LOGEST function in Excel is a function used to fit an exponential curve to exponential data. LOGEST is an array formula.
Note that while using Microsoft 365, LOGEST is compatible with dynamic arrays and does not require the use of Ctrl + Shift + Enter (CSE). Simply enter your formula in the top left of where you want your output array and the result will spill over to the other cells. The CSE method is required for older or standalone versions of Excel.
Exponential growth may be observed in data such as a virus spreading in a global pandemic.
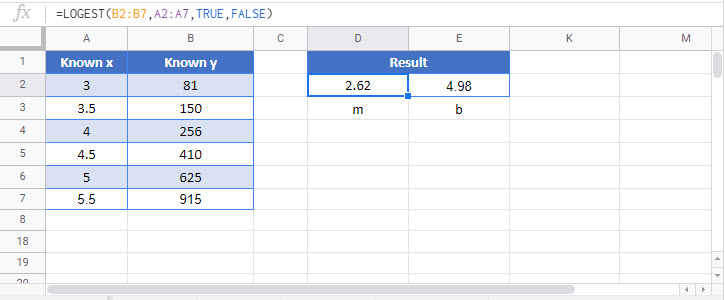
Suppose I have a table of data with x and y values where x is the independent variable and y is the dependent variable. We can use LOGEST to fit a curve to the data.
You may be wondering if this is an exponential curve, what do the result parameters represent? The cell E3 contains the m value and cell F3 contains the b value of the curve.
The equation of the exponential curve for a single x variable is:
![]()
Where,
b = y-intercept of the curve, and
m = the slope parameter of the curve, which can also be written as![]()
Using this alternate form of m, the equation can also be written as .
![]()
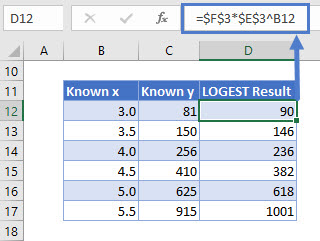
However, if I apply the result as a formula and compare the known y to the curve result, we will notice it is not a perfect fit (known y and LOGEST Result data doesn’t match).
Here is a visual representation using Excel’s built in exponential trendline:
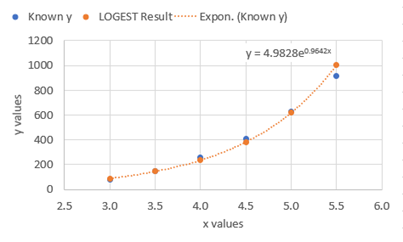
Notice the offset of the blue and orange data markers. Looking at the R2 value of the curve, we can numerically measure the fit. To do this, we set the [stats] option in the formula to TRUE.
The R2 value of the curve is 0.992. This is a great model but not perfect and therefore, has some small differences to the known values. The remaining statistics in cells E23 through F27 are described later in this article.
You may also notice the equation shown on the graph does not match the result of LOGEST shown in the first example.
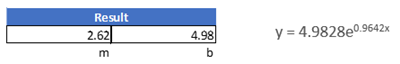
This is because we must take the natural logarithm of m and raise e to the power of that number.
ln(2.62)=0.9642.The natural logarithm of a number is the logarithm to the base of e, a mathematical constant approximately equal to 2.71828. The natural logarithm is typically written as ln(x).
Note that it is not required to do this conversion to achieve a value of y for a given x using the previously mentioned
![]()
Excel (and LOGEST) is already doing the behind the scenes math when calculating the m value.
How to use LOGEST
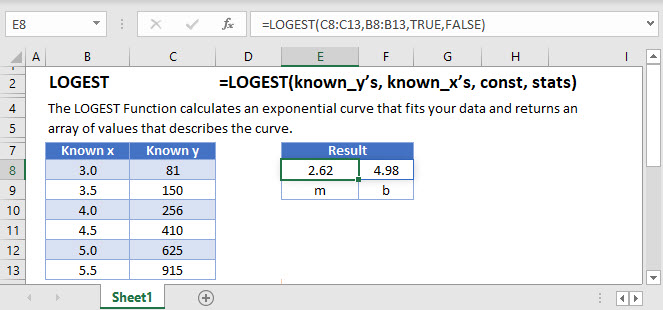
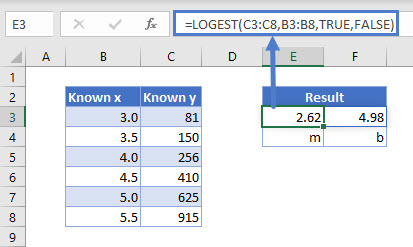
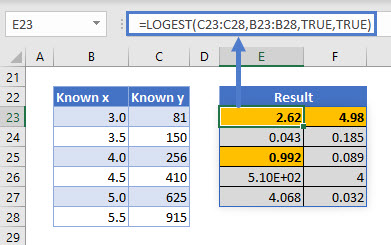
Using our first example, the function is written as:
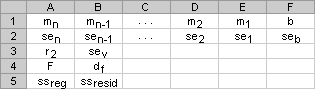
=LOGEST(C3:C8,B3:B8,TRUE,FALSE)When the [stats] option is set to TRUE, the organization of the regression statistics are as follows:
You may be wondering what each variable means.
| Statistic | Description |
| mn | Slope coefficients for x variables |
| b | y-intercept |
| sen | Standard error for each slope coefficient |
| seb | Standard error for the y-intercept |
| r2 | Coefficient of determination |
| sey | Standard error for the y estimate |
| F | The F statistic (to determine if the variables’ relationship occurs by chance) |
| df | Degrees of freedom |
| ssreg | Regression sum of squares |
| ssresid | Residual sum of squares |
The main statistics to understand are the slope coefficients, y-intercept and the coefficient of determination or the R2 value of the model.
The R2 value is an indicator of the strength of the correlation of the model. It can be thought of as an indicator of fit. A low R2 value would mean a poor correlation between your dependent and independent variables, and the opposite is true for high R2 values, with R2 = 1 being a perfect fit.
Forecasting
To forecast what the resulting value will be for a given x value, simply plug in the desired value. We will use x = 7.5 :
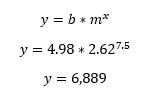
The GROWTH Function will perform this natively.
LOGEST with multiple x variables
Like LINEST, LOGEST can perform an exponential curve fitting using multiple independent (x) variables.
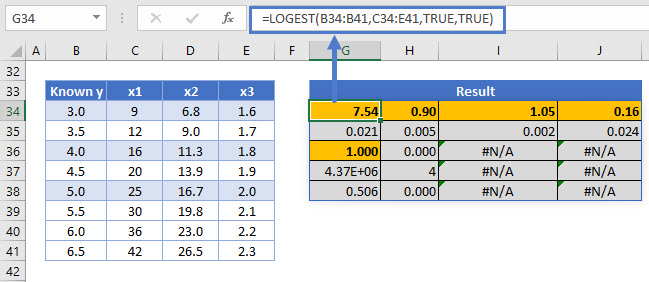
The equation for y when multiple x variables are included in the model is:
LOGEST Tips
- If you are on a non-Microsoft 365 release, you will have to use the legacy CTRL + SHIFT + ENTER (CSE) method of evaluating array formulas.
- If using the legacy method, the number of columns to highlight when entering a LOGEST array function is always the number of x variables in your data plus 1. The number of rows to select for the array is 5.
- If you will be sharing your dynamic array enabled version of Excel with someone who is using a non-Microsoft 365 release, use the legacy CSE method to avoid compatibility issues.
Interested in More Forecasting?
See our other articles on Forecasting with Exponential Smoothing, TREND, GROWTH and LINEST functions.
LOGEST function in Google Sheets
The LOGEST function works exactly the same in Google Sheets as in Excel.