STANDARDIZE Function Examples in Excel & Google Sheets
Written by
Reviewed by
This tutorial demonstrates how to use the STANDARDIZE Function in Excel to returns normalized value (z-score) based on the mean and standard deviation.
What Is the STANDARDIZE Function?
The STANDARDIZE Function returns the z-score of a value, given a specified mean and standard deviation.
What is a z-score?
As the function name implies, a z-score is a standardized version of a value. With a z-score, you convert a number from its raw value to a number indicating its distance from the mean in standard deviations.
To standardize scores in this way, you must know the mean and standard deviation of the population from which the value is drawn. If you are using sample data (for example if you’ve conducted a survey, and you want to extrapolate your results to a larger population), STANDARDIZE is not an appropriate function to use.
Note also that formula used to calculate the z-score assumes that your data fits a normal distribution.
If your data meets these requirements, you get a z-score for a given value with the following calculation:
z = (value – population mean) / population standard deviationStandardizing scores enables you to compare values in different data sets, even data that’s been measured in different units. Standardized scores also form the basis of a number of other statistical procedures – calculating them is most often done as an intermediate step towards carrying out further tests.
How to Use the STANDARDIZE Function
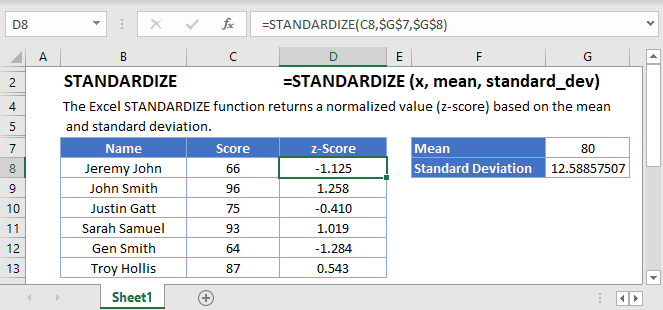
Use STANDARDIZE like this:
=STANDARDIZE(C4,$G$4,$G$3)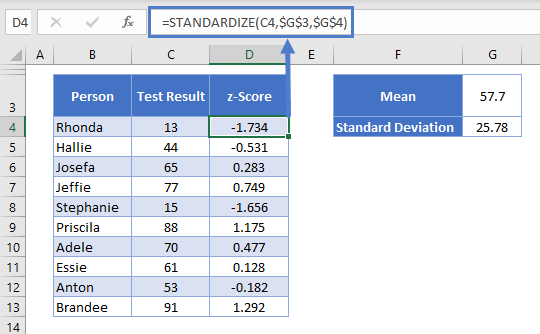
Above we have a list of test results from a class of 10 people. Their results are shown in column C, and in column D we have calculated the z-score for each one.
STANDARDIZE takes three arguments:
- The value that you want to standardize
- The mean of the population from which the data is drawn
- The standard deviation of the population from which the data is drawn (note that if you define a standard deviation below zero, you’ll get a #NUM! error)
In this example, we’re only interested in the z-scores of the students in this class. We’re not making estimates of all students’ scores based on this data, so this is population data. In this case it’s fine to just take the mean and standard deviation of the data we have. I’ve set these values out in the table to the right.
I calculated the mean, in cell G3, with the Excel Average Function<<link>>:
=AVERAGE(C4:C13)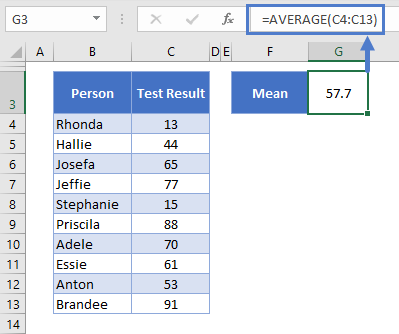
And I calculated the standard deviation, in G4, with the Excel STDEV.P Function<<link>>:
=STDEV.P(C4:C13)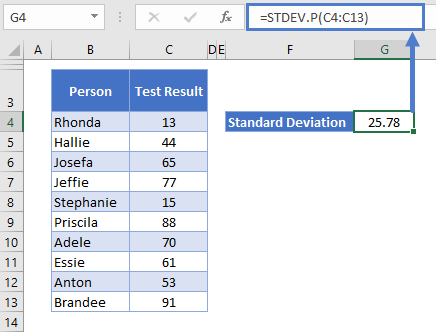
I then plugged these cell references into the STANDARDIZE function. The dollar signs around the column and row (e.g., $G$3) simply lock the cell reference, so that it stays the same when you copy the formula down the column.
So now in column D we have the z-scores for each data point. As noted earlier, the z-score is the distance of each score from the mean, expressed in standard deviations. So Rhonda’s test score is 1.734 standard deviations below the mean, Brandee’s score is 1.292 standard deviations above the mean, and so on.
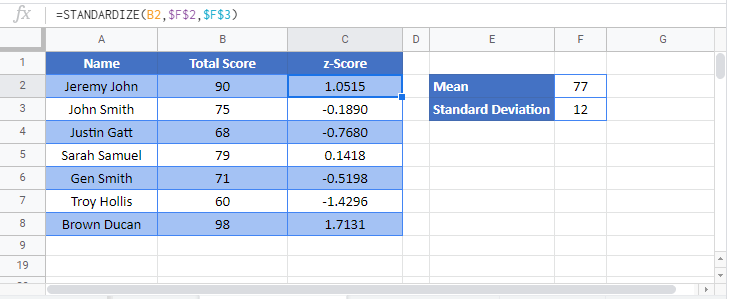
STANDARDIZE Function in Google Sheets
The STANDARDIZE Function works exactly the same in Google Sheets as in Excel: