Exponential Moving (Rolling) Average – Excel and Google Sheets
This tutorial will demonstrate how to calculate the Exponential Rolling Average in Excel and Google Sheets.
The Exponential Moving Average calculates the moving average of a subset of data points where each data point has weights assigned to them in such a way that the weights decrease exponentially as the data points go farther from the current value. In this article, we will look at how to calculate the exponential moving average.
Exponential Moving Average Formula
The k-data points exponential moving average (EMAk ) is calculated using the formula:

where xcurrent is the current data value;
EMAcurrent and EMAprevious are the current and the previous exponential moving averages, respectively; and
k is the desired number of periods.
Calculate Exponential Moving Average in Excel
Background: The closing prices of Apple Inc. stock on NASDAQ for the sixteen trading days from 2nd to 23rd May 2022 are shown in the table below. Calculate the 3-days and the 5-days exponential moving averages (EMA) for the stock prices.
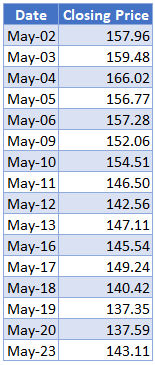
Calculate the 3-days EMA. Initialize the EMA by setting the first value of the dataset as the initial value of the EMA. So, enter the first closing price as the first EMA. That is, the first value of the 3-days EMA is the closing price of May-02 which is 157.96.
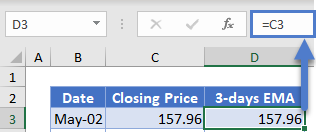
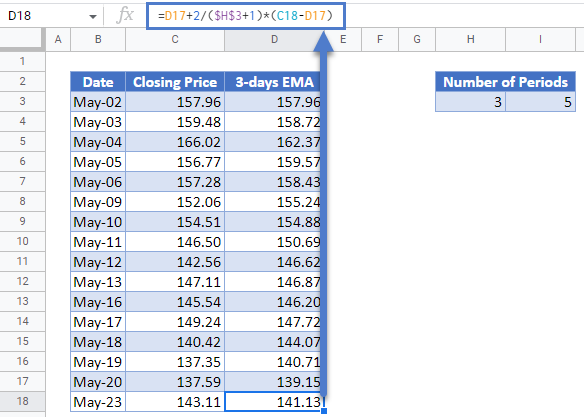
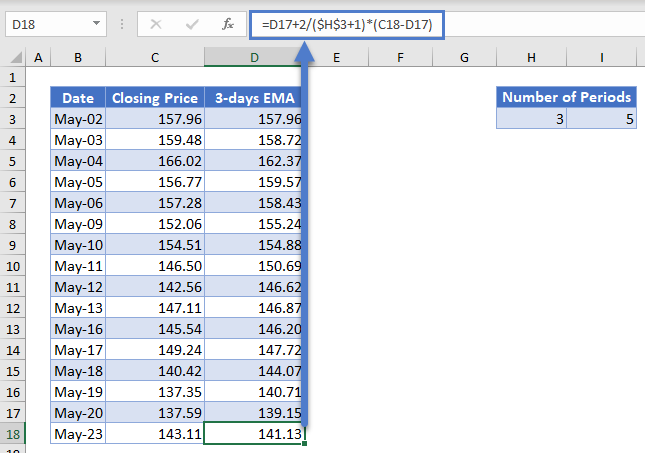
Next, calculate the 3-days EMAs using the formula stated above and the number of periods of 3-days, as shown in the picture below.

Autofill the rest of the column and you have the complete 3-days EMA column as shown below.
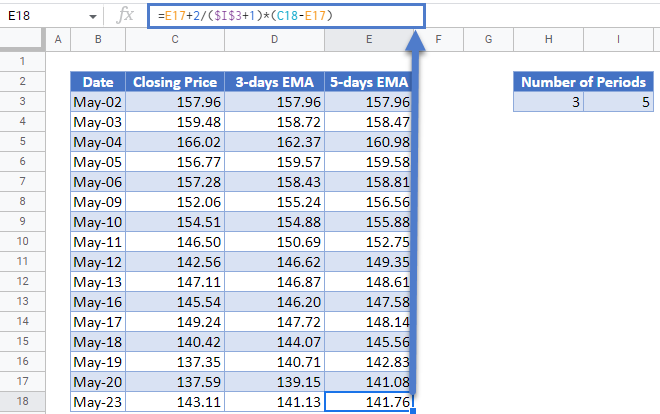
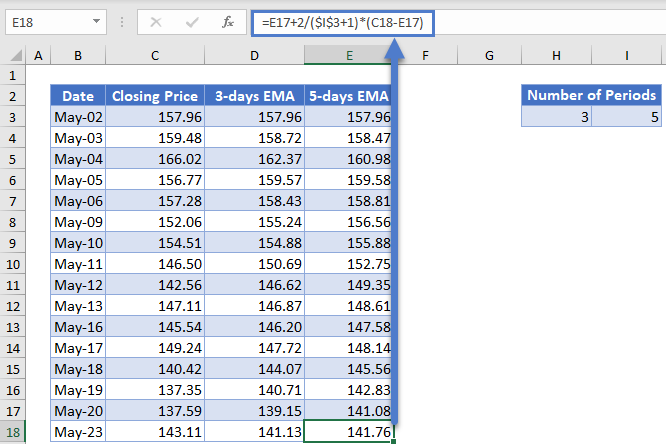
Next, calculate the 5-days EMA in a similar way as the 3-days EMA except that this time the number of periods is 5 days.

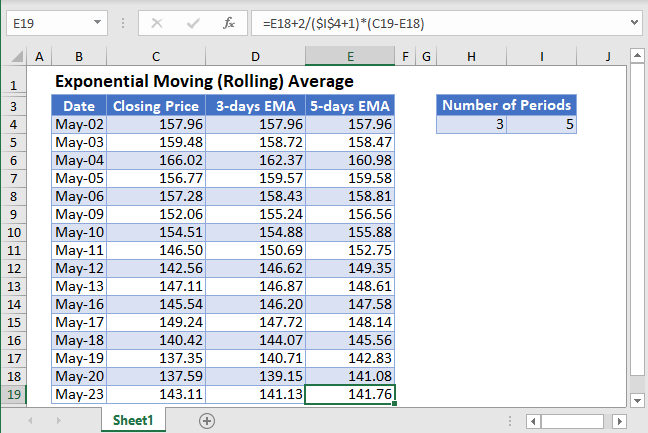
Autofill the rest of the column and you have the complete 5-days EMA column as shown below.
Exponential Moving Average in Google Sheets
Exponential Moving Average can be calculated in Google Sheets in a similar way as it is calculated in Excel as shown in the pictures below.
