Percent Frequency Distribution – Excel & Google Sheets
Written by
Reviewed by
This tutorial demonstrates how to calculate a percent frequency distribution in Excel and Google Sheets.
What is Percent Frequency Distribution?
The Percent Frequency Distribution displays the frequency (%) of each value in a data set.
Calculate Percent Frequency Distribution in Excel
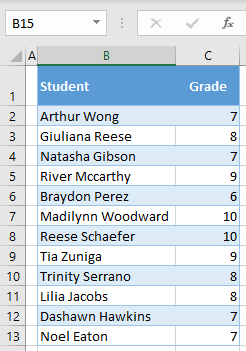
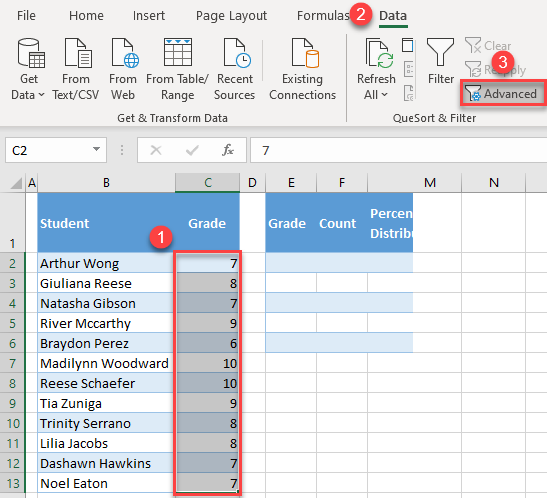
We will calculate the percent frequency distribution of this dataset:
The methods used will be different depending on which version of Excel you have.
Excel 365 & Other Newer Versions of Excel
List Unique Values
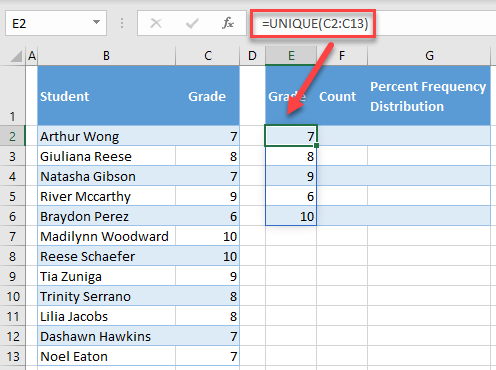
First, use the UNIQUE Function to display all the unique Grades from the dataset.
=UNIQUE(C2:C13)
Sort Values
Notice how the Grades are out of order? Next, add the SORT Function to sort the grades. Insert one helper column for this.
=SORT(E2:E6)
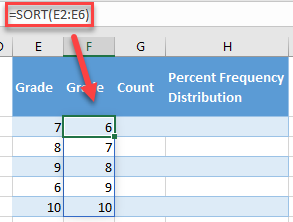
Now you can hide column E, as you don’t need it anymore. If you want to delete it, be aware to copy and paste as values grades in column F.
Note: These are Array Formulas, which means that you can enter the formula once and the values will “spill”. No need to copy + paste the formulas down the column!
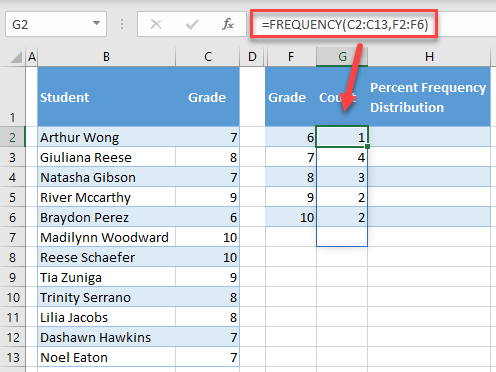
Count Unique Values
Next, we will count the unique values. We can create an array formula with the FREQUENCY Function:
=FREQUENCY(C2:C13,F2:F6)
Calculate Percent Frequency Distribution
Next, we will calculate the percent frequency distribution.
=F2/SUM($G$2:$G$6)
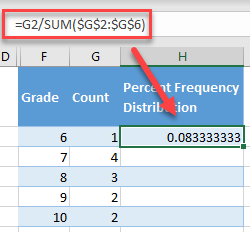
Note: Be sure to lock cell references with $ so that you can copy + paste the formula down the column.
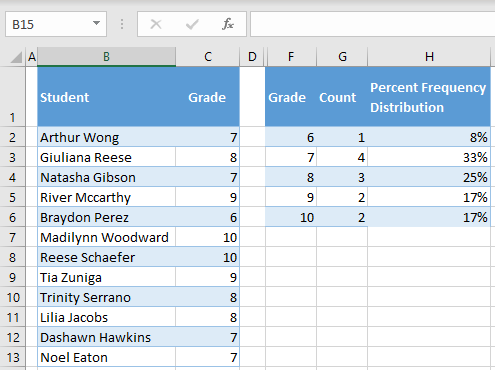
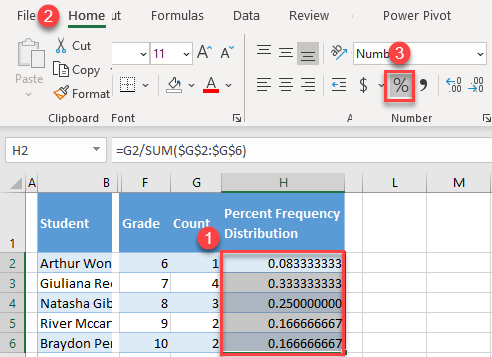
Last, format the data as percentages. (1) Select a range with distribution (H2:H6), and in the Ribbon, (2) go to the Home tab, and (3) click on the percentage symbol in the Number group.

As a result, you have the percent frequency distribution for grades in column H.
Older Versions of Excel
If you are using older versions of Excel, you won’t have access to the UNIQUE, SORT, or FREQUENCY Functions. Instead, you can do the following steps.
List Unique Values
You can use the advanced filter to extract unique values. To do this, follow the next steps.
1. (1) Select a range with grades in the dataset (C2:C13), and in the Ribbon, (2) go to Data > Advanced.
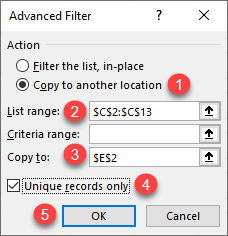
2. In the Advanced Filter, (1) check Copy to another location, (2) enter $C$2:$C$13 for List range, (3) enter $E$2 in the Copy to box, (4) check Unique records only, and (5) click OK.
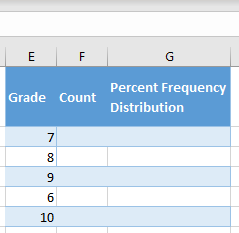
As a result, unique values from range C2:C13 are extracted in column E.
Sort Values
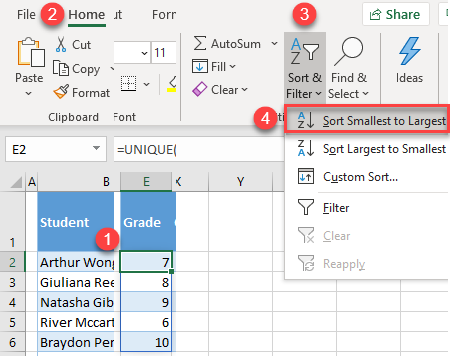
Notice how the Grades are out of order? Next, we will sort the data.
To sort, (1) click anywhere in column E, and in the Ribbon, (2) go to Home > Sort & Filter > Sort Smallest to Largest.
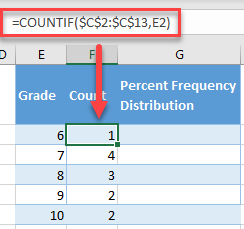
Count Unique Values
Next, we will count the unique values. We can achieve it with the COUNTIF Function:
=COUNTIF($C$2:$C$13,E2)
And double click or drag the fill handle to expand the formula to row 7.
Note: Be sure to lock cell references for the range with $ so that formula can work properly.
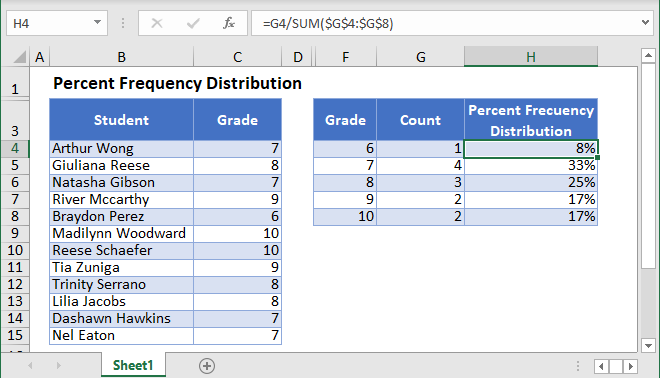
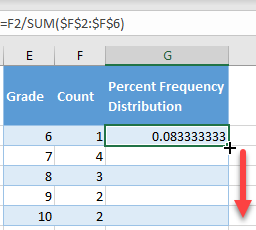
Calculate Percent Frequency Distribution
Next, we will calculate the percent frequency distribution.
=F2/SUM($F$2:$F$6)
Note: Be sure to lock cell references with $ so that you can copy + paste the formula down the column.
Last, format the data as percentages. (1) Select a range with distribution (G2:G6), and in the Ribbon, (2) go to the Home tab, and (3) click on the percentage symbol in the Number group.
As a result, you have the percent frequency distribution for grades in column G.
Calculate Percent Frequency Distribution in Google Sheets
Similar to Excel, you can also get percent frequency distribution in Google Sheets. To do this, follow the next steps.
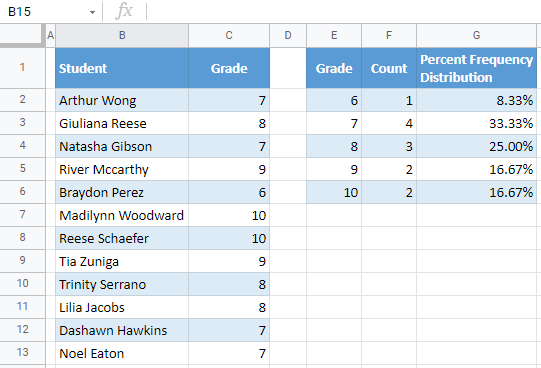
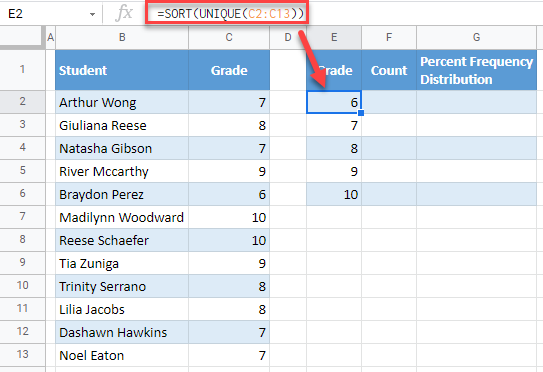
1. In Google Sheets, you can immediately extract sorted unique values. In cell E2, enter the formula:
=SORT(UNIQUE(C2:C13))
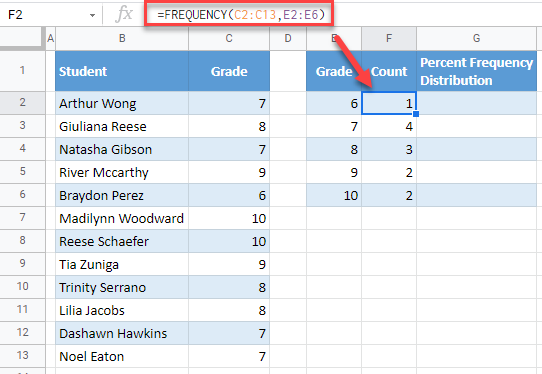
2. In cell F2, enter the formula:
=FREQUENCY(C2:C13,E2:E6)
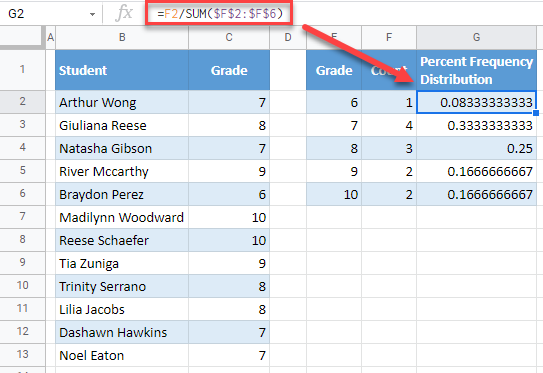
3. In cell G2, enter the formula:
=F2/SUM($F$2:$F$6)
4. Now, format the values in column G as percentages. (1) Select values in column G (G2:G6), and in the menu, (2) click on the Percentage icon.
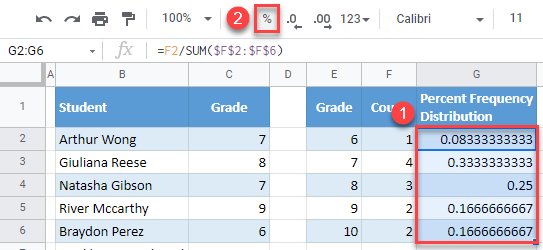
As a result, you now have the percent frequency distribution in column G.