Shapiro-Wilk Royston Test – Excel and Google Sheets
Written by
Reviewed by
This tutorial will demonstrate how to use the Shapiro-Wilk Royston Test in Excel and Google Sheets.
The original Shapiro-Wilk test, like most significance tests, is affected by the sample size and works best for sample sizes of n=2 to n=50. For larger sample sizes (up to n=2000), an extension of the Shapiro-Wilk test called the Shapiro-Wilk Royston test can be used.
This article examines the Shapiro-Wilk Royston test which is the more popular version of the Shapiro-Wilk test used by many popular statistical software packages. To learn more about how to perform the original Shapiro-Wilk test, see the Shapiro-Wilk test article.
How the Shapiro-Wilk Royston Test Works
The Shapiro-Wilk test tests the null hypothesis that the dataset comes from a normally distributed population against the alternative hypothesis that the dataset does not come from a normally distributed population.
The W statistics for a Shapiro-Wilk Royston test is given as follows:
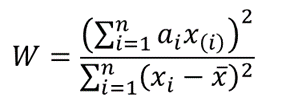
where x(i) is the i th order statistic (i.e. the i th data value after the dataset is arranged in ascending order),
![]() is the mean (average) of the dataset,
is the mean (average) of the dataset,
n is the number of data points in the dataset,
a=(a1,…,an ) is the coefficient vector of the weights of the Shapiro-Wilk test representing the best linear estimate of the standard deviation of xi, assuming normality, which we will approximate using Royston’s algorithm.
The vector a is anti-symmetric, that is a(n+1-i) =-ai for all i, and a(n+1)/2 =0 for odd n. Also, .
Royston’s Algorithm for the Approximation of a
Royston’s algorithm for the approximation of a for the Shapiro-Wilk test starts with the fact that W statistics is asymptotically equivalent to the statistic![]() , where
, where ![]() ,
, ![]() is the expectation vector of x(i) with n standard normal random variables,
is the expectation vector of x(i) with n standard normal random variables, ![]() , and Φ is the normal cdf.
, and Φ is the normal cdf.
Using the values above and setting ![]() , we have the following approximations for ai:
, we have the following approximations for ai:
![]()
![]()
and
Where:
The Shapiro-Wilk Royston Test’s Test Statistic
For values of n between 4 and 11 , the statistic, w=-ln[0.459n-2.273-ln(1-W) ] , can be modeled with normal distribution with a mean, μ=0.544-0.39978n+0.062767n2-0.0020322n3 and a standard deviation,
σ = exp(1.3822-0.77857n+0.062767n2-0.0020322n3 )
Similarly, for values of n between 12 and 2000, the statistic, w = ln(1-W), is normally distributed with a mean,
μ = 0.0038915x3 – 0.083751x2 – 0.31082x – 1.5861, and a standard deviation,
σ = exp(0.0030302x2 – 0.082676x – 0.4803), where x = ln n.
Thus, for the Shapiro-Wilk Royston test, the z-statistic is used as the test statistic and is given by
To find the p-value of the test, the z-score obtained above refers to the upper (right) tail of the standard normal curve.
If the obtained p-value is less than the chosen significant (alpha) level, the null hypothesis is rejected, and it is concluded that the dataset is not from a normally distributed population, otherwise, the null hypothesis is not rejected and it is concluded that there is no statistically significant evidence that the dataset does not come from a normally distributed population.
How to Perform the Shapiro-Wilk Royston Test in Excel
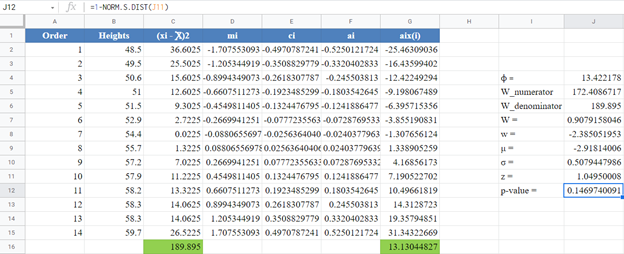
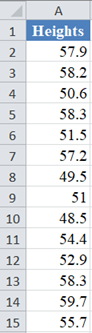
Background: A sample of the heights, in inches, of 14 ten years old boys are presented in the table below. Use the Shapiro-Wilk Royston method of testing for normality to test whether the data obtained from the sample can be modeled using a normal distribution.
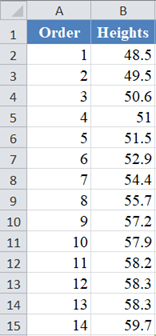
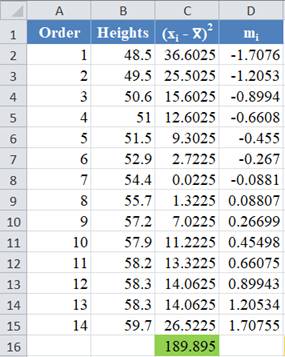
First, select the values in the dataset and Sort the data: Data > Sort (Sort Smallest to Largest) to arrange the values in ascending order as shown below:

And the arranged values are as follows:
Alternatively, with newer versions of Excel, you can use the SORT Function to sort the data:
=SORT(B2:B15)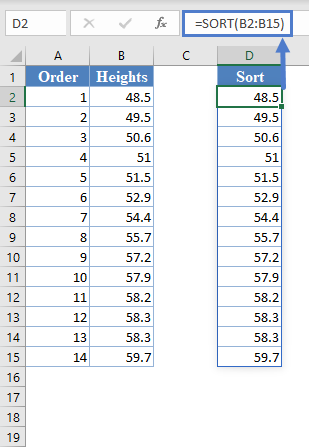
Next, calculate the W denominator of the statistic, ![]() , as shown in the picture below:
, as shown in the picture below:
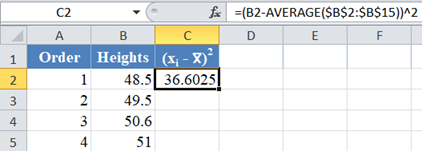
Complete the rest of the column and then calculate the sum (shown in green background) as shown in the picture below:
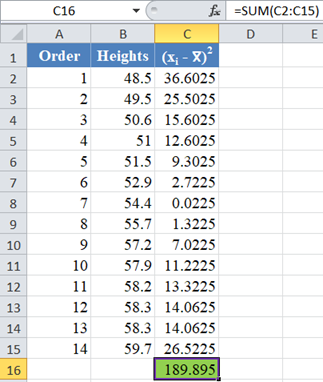
Thus, the denominator of the W statistic is 189.895.
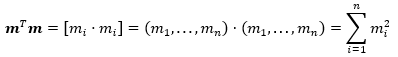
Next, obtain the values of using the NORM.S.INV Function with the formula:

The formula and the value of m1 are shown in the picture below:
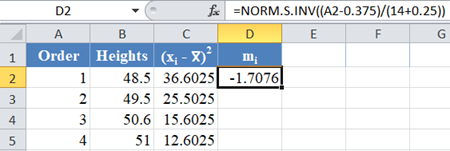
*Note that for our case, n = 14 because we have 14 data points.
Complete the rest of the column as shown in the picture below:
Now, since ![]() is a column vector, then it follows that.
is a column vector, then it follows that.
Thus, the value of ![]() can be calculated in Excel using the SUMSQ Function.
can be calculated in Excel using the SUMSQ Function.
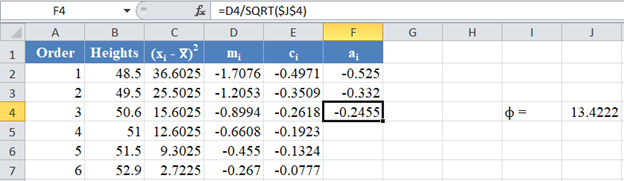
Thus, calculate the values of ci using the formula:
![]()
The formula for the value of C1 is shown in the picture below:
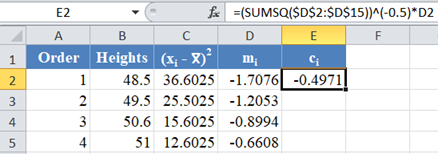
Complete the rest of the column as shown in the picture below:
Next, use the formula given above to calculate the values of an and a(n-1) for n=14, and because of the anti-symmetric property of ai , an+1-i = – ai . That is, a14 = a1 , a13 = a2, etc.
The formula and values of a14 and a1 are shown in the picture below:
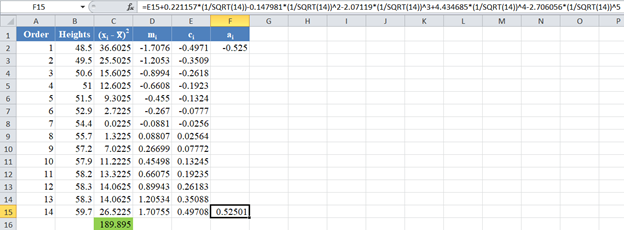
Similarly, the formula and values of a13 and a2 are shown in the picture below:
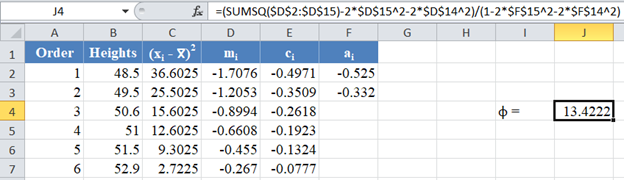
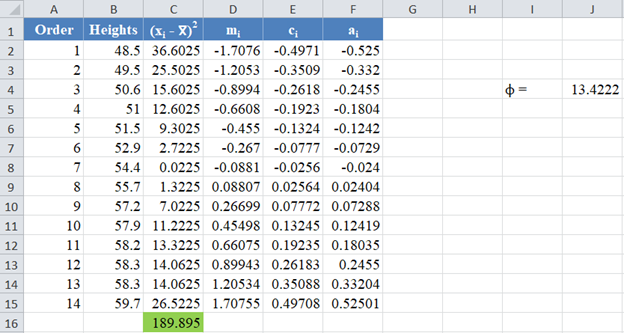
Next, obtain the value of ![]() , noting that, as established above,
, noting that, as established above,![]() . The formula and the value of ϕ are shown in the picture below:
. The formula and the value of ϕ are shown in the picture below:
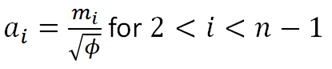
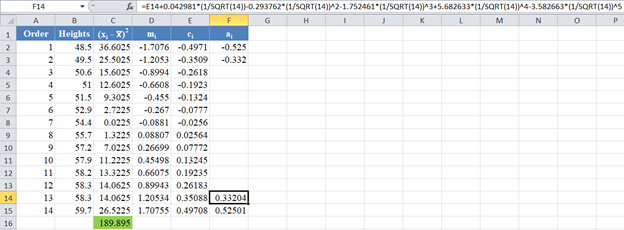
Then, using the value of ϕ, obtain the values of the rest of the ai column using the formula: ![]() for . The picture below shows the formula and value of a3 :
for . The picture below shows the formula and value of a3 :
Thus, the complete values of the ai column are shown in the picture below:
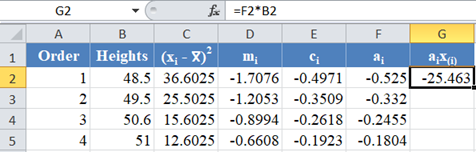
Next, multiply the ai values with the corresponding (already arranged) values in the dataset to get the ai x(i)
column. The calculation and the value for the first data point are shown in the picture below:
Complete the rest of the ai x(i) column and calculate the sum (shown in green background) as shown in the picture below:
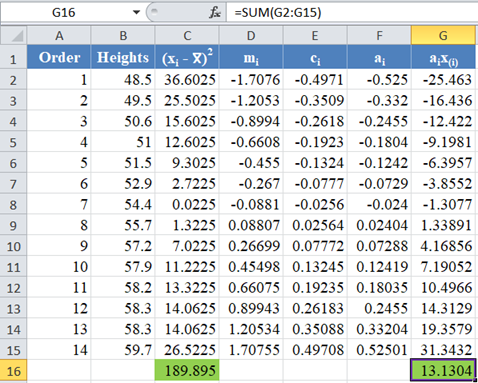
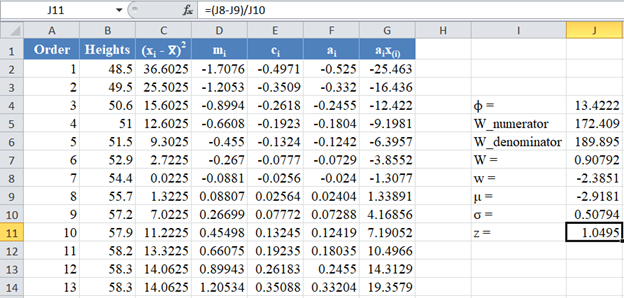
The denominator of the W statistic as obtained previously is 189.895 , and the numerator is the square of the sum of the ai x(i) column. Thus, we have as follows:
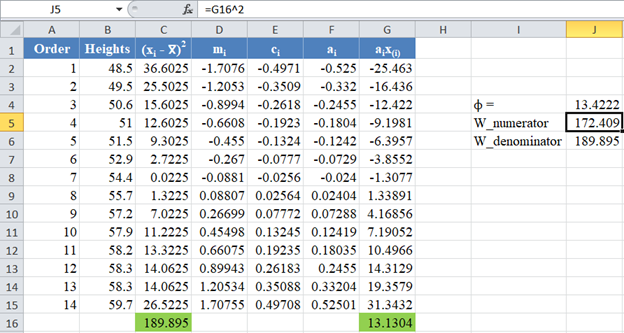
Therefore, the W statistic is as shown below:
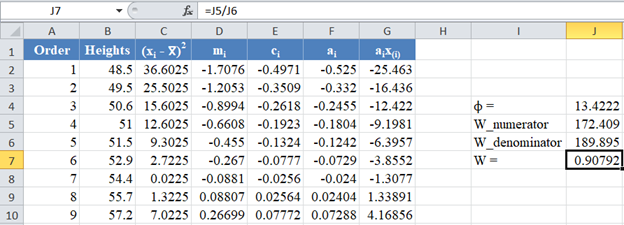
*Note that the value of the W statistic will always be between 0 and 1.
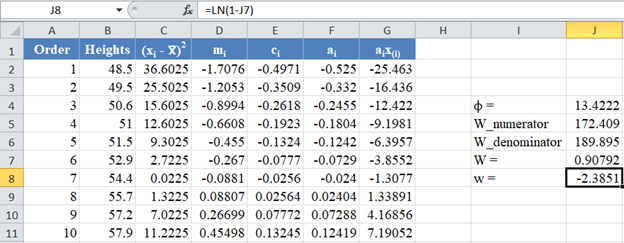
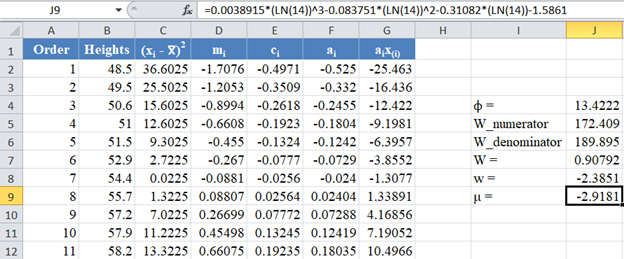
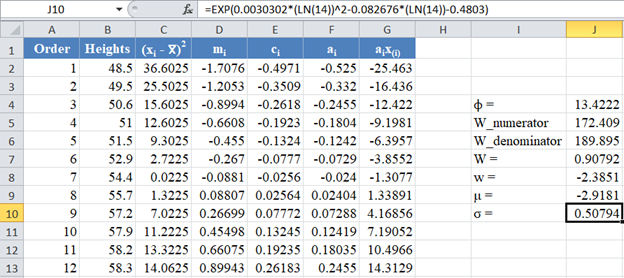
Next, obtain the values of the w statistic, μ and σ using the formulas stated previously in this article.
For our case, n=14, so we use the formula w=ln(1-W) as shown in the picture below:
Calculate the value of μ as shown in the picture below:
Also, calculate the value of σ as shown in the picture below:
Next, obtain the z-score using the formula stated previously as shown in the picture below:
Finally, obtain the p-value using the NORM.S.DIST Function.
Since the p-value of the Shapiro-Wilk Royston test is the upper tail of the standard normal curve, we used the formula: p-value 1 – NORM.S.DIST(z, TRUE) to obtain the p-value as shown in the picture below:
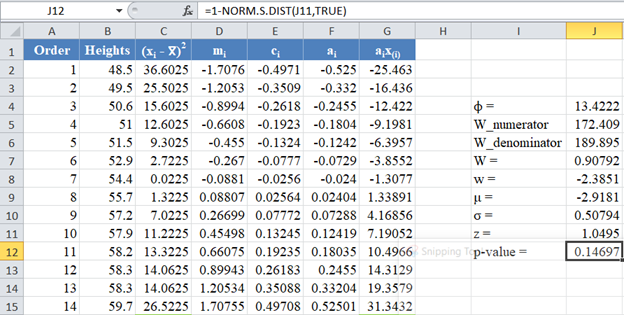
The p-value is 0.14697, which is greater than α=0.05, hence, the null hypothesis is not rejected.
Therefore, we conclude that there is not enough evidence that the dataset is not drawn from a normally distributed population. That is, we can assume that the dataset is normally distributed.
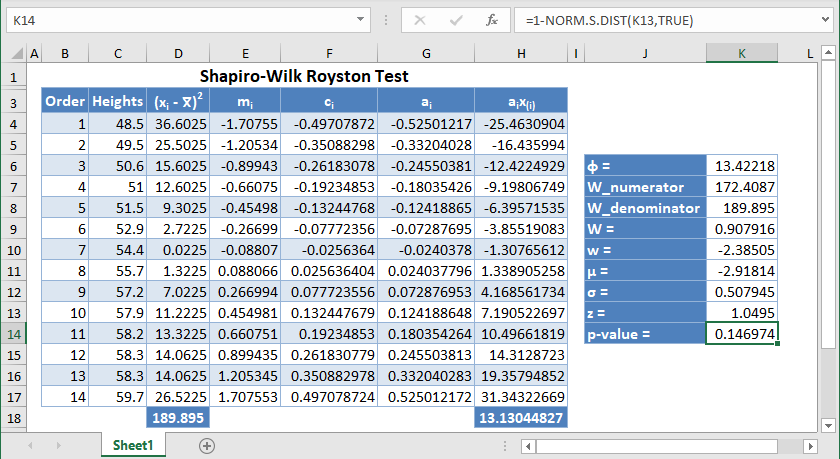
Shapiro-Wilk Royston Test in Google Sheets
Shapiro-Wilk Royston test can be conducted in Google Sheets in a similar way as done in Excel as shown in the picture below.