Shapiro-Wilk Test Excel and Google Sheets
Written by
Reviewed by
This tutorial will demonstrate ho to perform the Shapiro-Wilk test in Excel and Google Sheets.
Shapiro-Wilk test is a statistical test conducted to determine whether a dataset can be modeled using the normal distribution, and thus, whether a randomly selected subset of the dataset can be said to be normally distributed. The Shapiro-Wilk test is considered one of the best among the numerical methods of testing for normality because of its high statistical power.
The original Shapiro-Wilk test, like most significance tests, is affected by the sample size and works best for sample sizes of n=2 to n=50. For larger sample sizes (up to n=2000), an extension of the Shapiro-Wilk test called the Shapiro-Wilk Royston test can be used.
How Shapiro-Wilk Test Works
The Shapiro-Wilk test tests the null hypothesis that the dataset comes from a normally distributed population against the alternative hypothesis that the dataset does not come from a normally distributed population.
The test statistics for the Shapiro-Wilk test is given as follows:
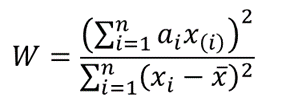
where x(i) is the ith order statistic (i.e. the ith data value after the dataset is arranged in ascending order),
![]() is the mean (average) of the dataset.
is the mean (average) of the dataset.
n is the number of data points in the dataset, and
a = [ai] = (a1,…,an ) is the coefficient vector of the weights of the Shapiro-Wilk test (obtained from the Shapiro-Wilk test table),
The vector a is anti-symmetric, that is a n+1-i =-ai for all i, and a(n+1)/2 = 0 for odd n. Also, aT a = 1.
The p-value is obtained by comparing the W statistic with the W values presented in the Shapiro-Wilk test table of p-values for the given sample size.
- If the obtained -value is less than the chosen significance level, the null hypothesis is rejected, and it is concluded that the dataset is not from a normally distributed population,
- Otherwise, the null hypothesis is not rejected and it is concluded that there is no statistically significant evidence that the dataset does not come from a normally distributed population.
How to Perform the Shapiro-Wilk Test in Excel
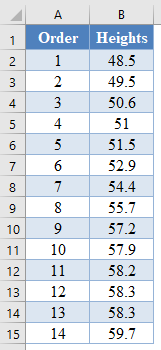
Background: A sample of the heights, in inches, of 14 ten years old boys are presented in the table below. Use the Shapiro-Wilk method of testing for normality to test whether the data obtained from the sample can be modeled using a normal distribution.
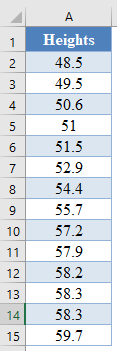
First, select the values in the dataset and Sort the data using the Sort tool: Data > Sort (Sort Smallest to Largest)

This will sort the values like so:
Alternatively, with newer versions of Excel, you can use the SORT Function to sort the data:
=SORT(B2:B15)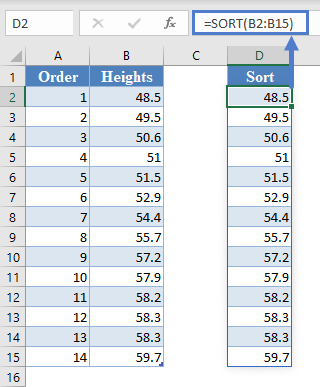
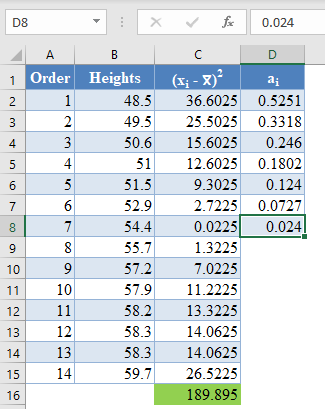
Next, calculate the denominator of the W statistic, ![]() , as shown in the picture below, using AVERAGE to calculate the mean:
, as shown in the picture below, using AVERAGE to calculate the mean:
=(B2-AVERAGE($B$2:$B$15))^2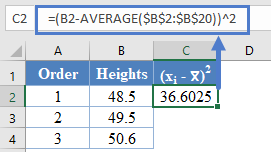
Complete the rest of the column and then calculate the sum (shown in green background) as shown in the picture below:
=SUM(C2:C15)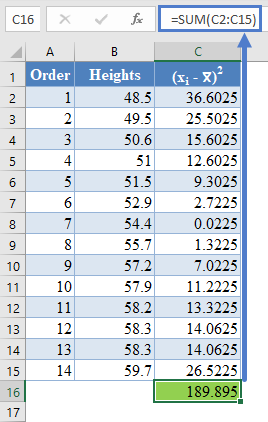
Thus, the denominator of the W statistic is 189.895.
Next, obtain the values of ai , the coefficients of the weights of the Shapiro-Wilk test, for a sample size of n=14 from the Shapiro-Wilk test table. An excerpt of the Shapiro-Wilk test table is shown below:
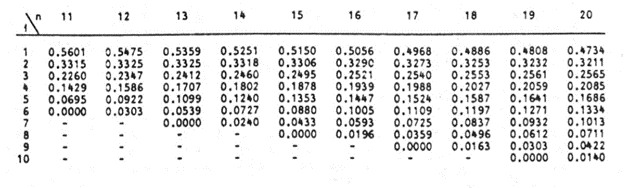
These values will need to be entered manually as follows:
And using the anti-symmetric property of ai, that is, an+1-i=-ai for all i, we have that a14=-a1, a13=-a2, etc. So, the complete values of the ai column are shown in the picture below:
=-D8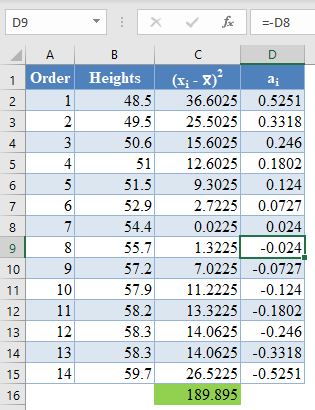
*Note that because of the anti-symmetric property of ai and since that numerator of the W statistic is a square, it does not matter which half of the ai column is positive or negative. That is, you can choose to make the upper half of the column to be positive and the lower half negative or vice-versa and it will not affect your final result.
Next, multiply the ai values with the corresponding (already arranged) values in the dataset to get the ai x(i) column. The calculation and the value for the first data point are shown in the picture below:
=D2*B2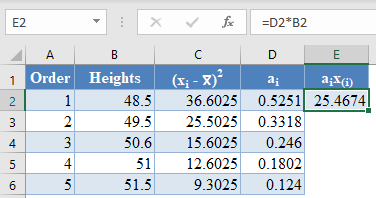
Complete the rest of the ai x(i) column and calculate the sum (shown in green background) as shown in the picture below:
=sum(E2:E15)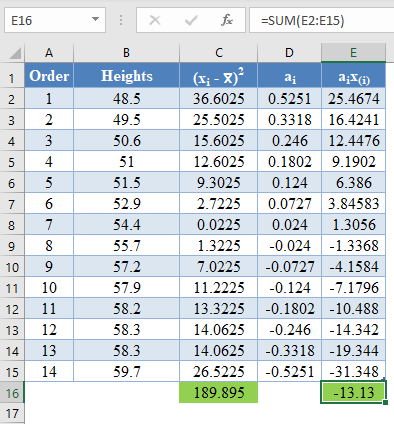
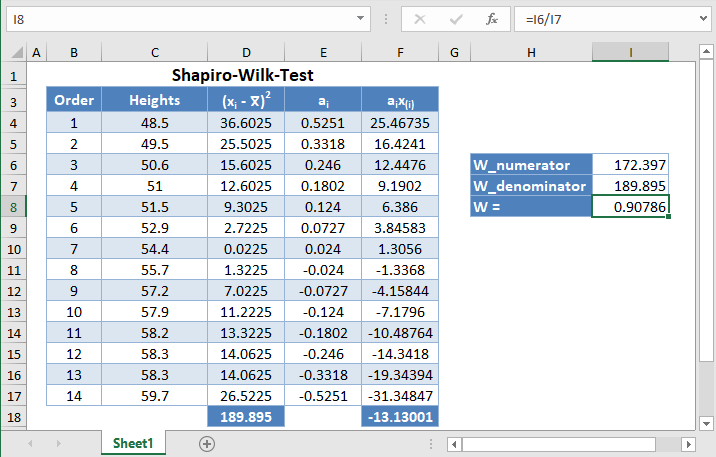
The denominator of the W statistic as obtained previously is 189.895 , and the numerator is the square of the sum of the ai x(i) column. Thus, we have as follows:
=E16^2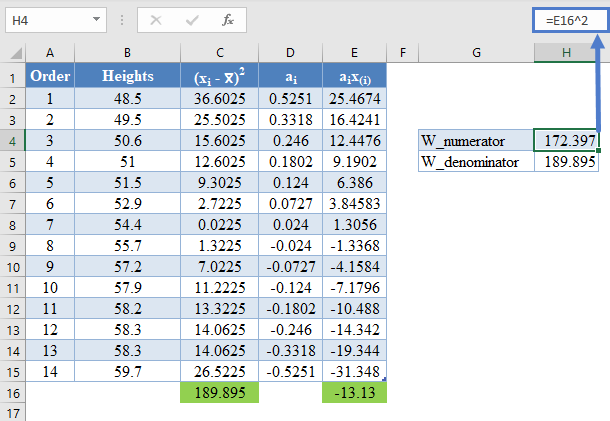
Therefore, the W statistic is as shown below:
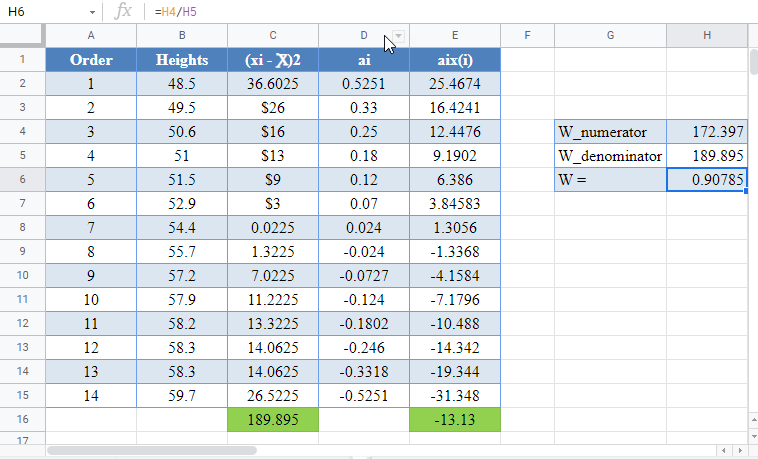
=H4/H5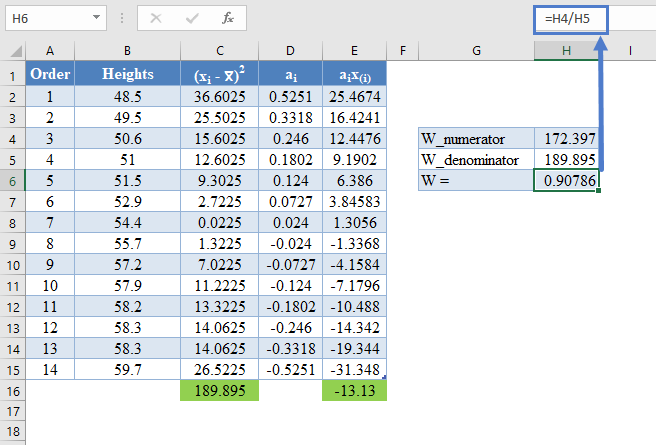
Finally, obtain the p-value of the test using the Shapiro-Wilk test table of p-values considering the sample size.
An excerpt of the Shapiro-Wilk test table of p-values is shown below:
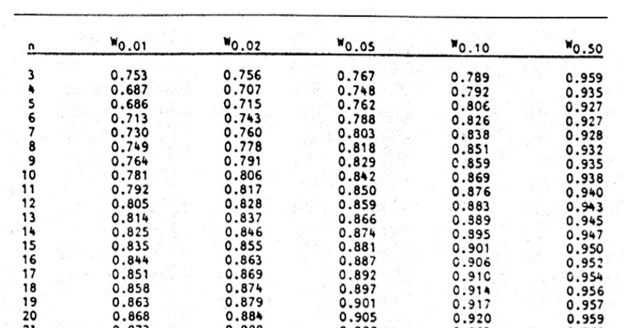
For this test, we will use a significance (alpha) level of 0.05. From the table, you can see that for n =14, W = 0.90786 is between W0.10 = 0.895 and W0.50 = 0.947, which means that the p-value is between 0.10 and 0.50. This means that the p-value is greater than α = 0.05, hence, the null hypothesis is not rejected.
Therefore, we conclude that there is not enough evidence that the dataset is not drawn from a normally distributed population. That is, we can assume that the dataset is normally distributed.
*Using linear interpolation, you can get that the approximate p-value is 0.1989.
Shapiro-Wilk Test in Google Sheets
Shapiro-Wilk test can be conducted in Google Sheets in a similar way as done in Excel as shown in the picture below.