SLOPE Function Examples in Excel, VBA, & Google Sheets
Written by
Reviewed by
Download the example workbook
This tutorial demonstrates how to use the SLOPE Function in Excel to calculate the slope.
What is the SLOPE Function?
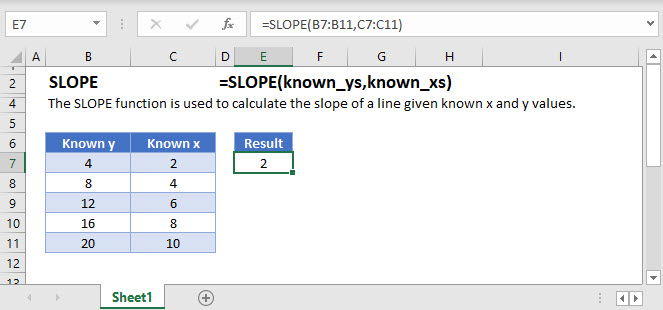
The SLOPE function in Excel is used to calculate the slope of a line given known x and y values.
The SLOPE function can be used in conjunction with the INTERCEPT function to find the equation of a linear line,
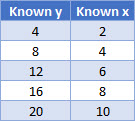
y = a + bxSuppose I have a table of data with x and y values:
The slope of a line is calculated by plotting the data and using the
![]()
method, demonstrated below:
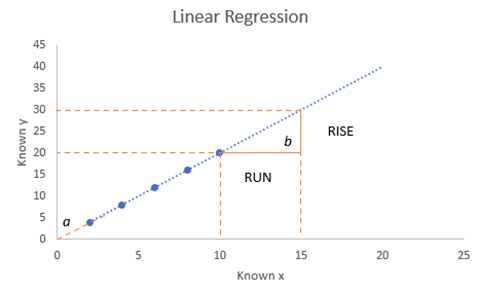
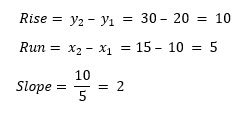
Using the above chart, we can calculate the slope, b using the rise of the line divided by the run of the line.
Using the SLOPE function:
How to use SLOPE
The SLOPE function takes two arguments:
=SLOPE(known_y’s, known_x’s)Where known_y’s and known_x’s refer to the x and y data in your data table.
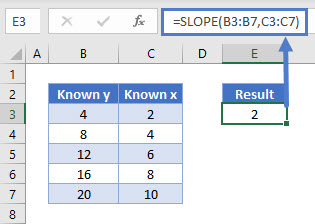
Using our first example, the function is written as:
=SLOPE(B3:B7,C3:C7)Pairing SLOPE and INTERCEPT
To pair SLOPE and INTERCEPT, an equation can be written as:
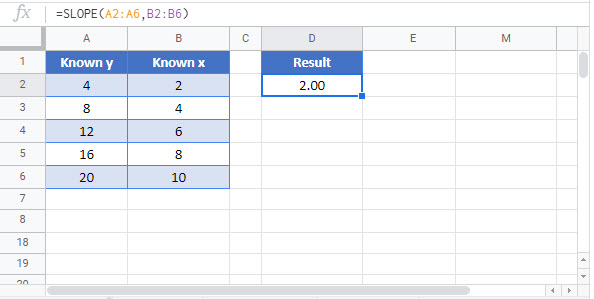
=INTERCEPT(B3:B7,C3:C7) + SLOPE(B3:B7,C3:C7) * xSLOPE function in Google Sheets
The SLOPE function works exactly the same in Google Sheets as in Excel.
SLOPE Examples in VBA
You can also use the SLOPE function in VBA. Type:
application.worksheetfunction.slope(known_ys,known_xs)
