Create Auto Outline in Excel to Group Rows & Columns
Written by
Reviewed by
This tutorial demonstrates how to automatically create an outline to group rows and columns in Excel.
Excel has grouping functionality that combines rows and/or columns into logical groups. If your worksheet is organized in a way that is compatible with Excel’s grouping functionality, you can use the Auto Outline feature. You would need to have the information correctly organized in a logical manner where there are subtotals for each level of information you wish to group on. The data cannot have any blank rows or columns, or spaces.
Create Auto Outline
- First, organize your data logically with subtotals, and then click anywhere within the data.
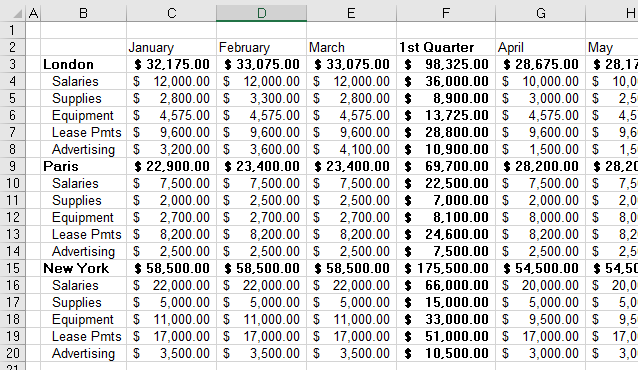
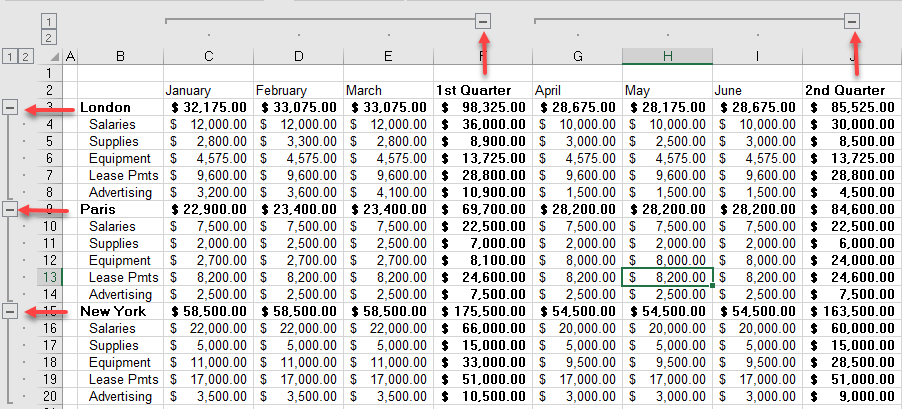
▸ In the example below, going down the rows, the data is organized into cities (London, Paris, and New York), and in each of these cities there are categories for values which are totaled at the top of each city. Going across the columns, the data is separated into months which are then totaled after each quarter.
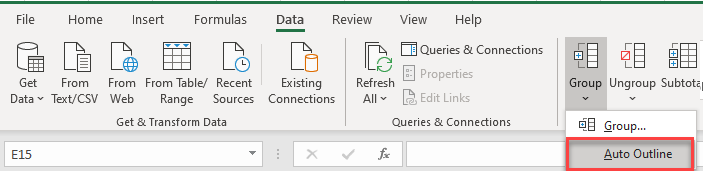
- In the Ribbon, go to Data > Outline > Group > Auto Outline.
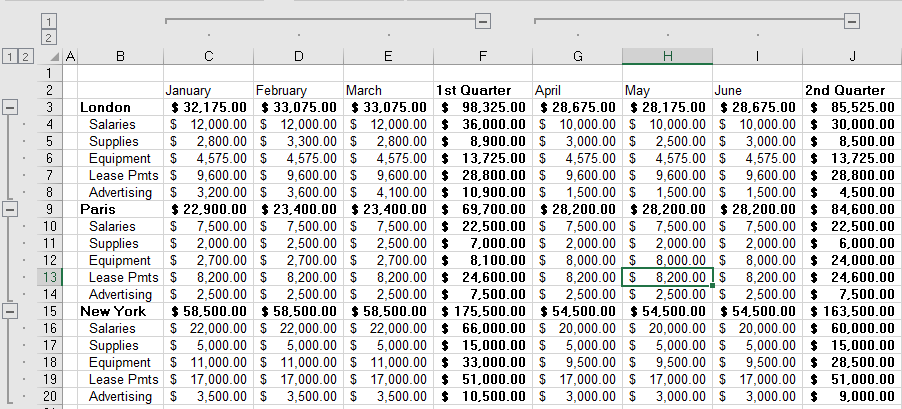
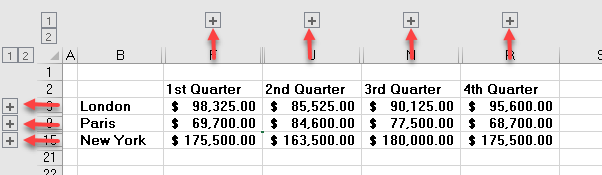
The data is automatically organized into groups based on the subtotals found in the data (the total of each city and the total of each quarter).
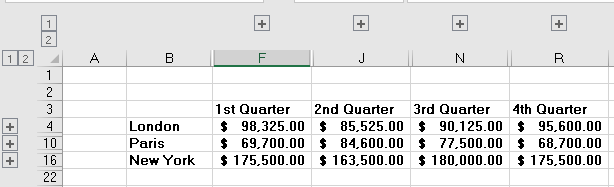
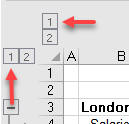
- To collapse each group, click the collapse buttons (minus signs) at the end of each group.
OR
To collapse all groups, click each of the 1 buttons in the top-left corner of the screen.
-
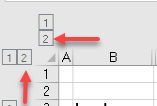
- Then, use the expand buttons to show all rows once again.
OR
To expand all groups at once, click the 2 buttons in the top-left corner of the screen.
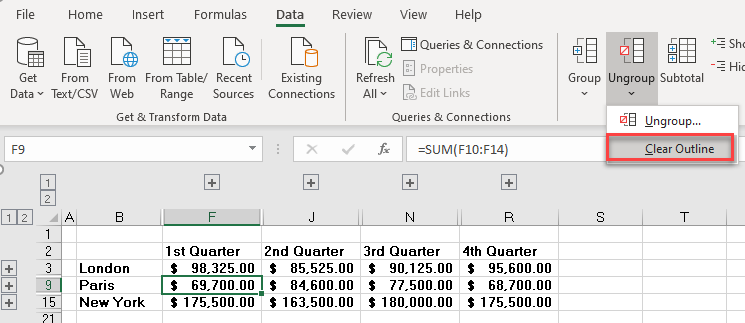
Remove Auto Outline
- To remove an existing outline, first select any cell within the outlined data.
- Then in the Ribbon, go to Data > Outline > Ungroup > Clear Outline.
None of the data changes, but the outline buttons are gone, and anything that was hidden (collapsed) is visible.
