Expand / Collapse Rows or Columns in Excel & Google Sheets
Written by
Reviewed by
In this tutorial, you will learn how to expand and collapse rows or columns by grouping them in Excel and Google Sheets.
Excel allows us to group and ungroup data, which enables us to expand or collapse rows and columns to better organize our spreadsheets. This is possible by grouping data manually or using the Auto Outline option.
Group and Ungroup Rows Manually
If we want to group rows in Excel, we need to have data organized in a way that’s compatible with Excel’s grouping functionality. This means that we need several levels of information sorted correctly and subtotals for each level of information that we want to group. Also, data must not have any blank rows or spaces.
In the following example, we have total sales per month by product. Therefore, data are sorted by month and product and we have subtotals for each month, as we want to group data by month.
To group data for Jan-21 and Feb-21:
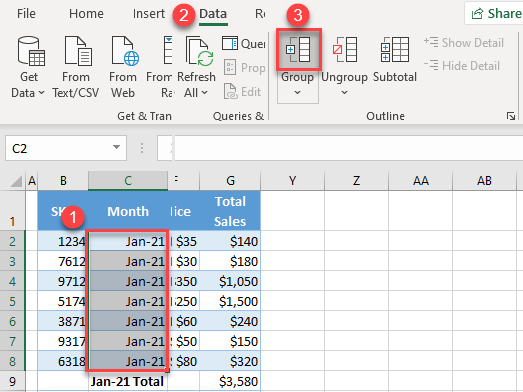
1. (1) Select data in the column that we want to group. In our case that is Jan-21, so we’ll select C2:C8. Then, in the Ribbon, (2) go to the Data tab, and in the Outline section, (3) click on the Group icon. (Note that you could also use a keyboard shortcut instead: ALT + SHIFT + right arrow).
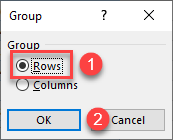
3. In the new window, leave Rows selected since we want to group rows and click OK.
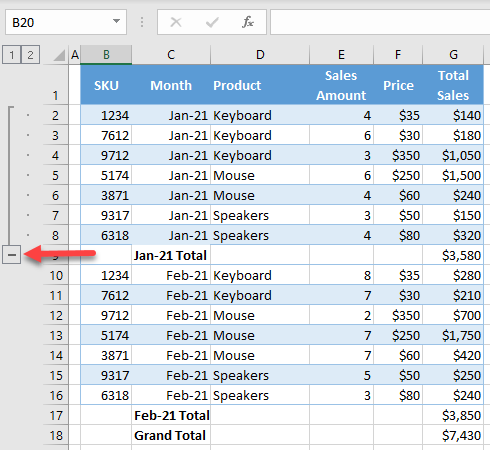
As a result, we get the outline bar on the left side with Jan-21 grouped.
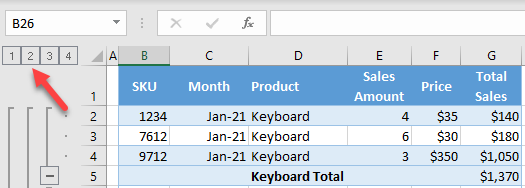
4. If we want to collapse this group of data, we just need to click on the minus sign in the outline bar.
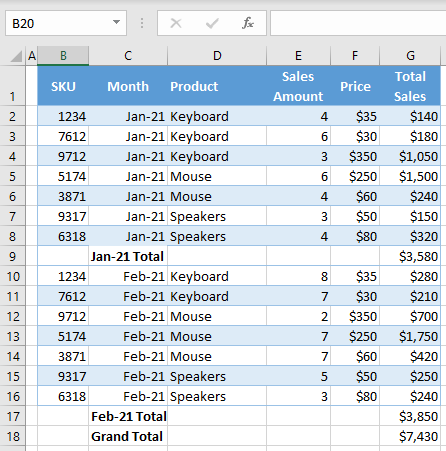
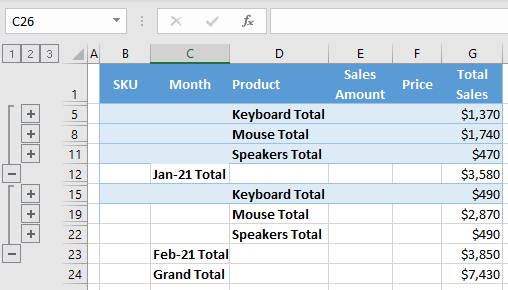
As shown in the picture below, all rows with Jan-21 in Column C are collapsed now and only the subtotal for this period remains visible.
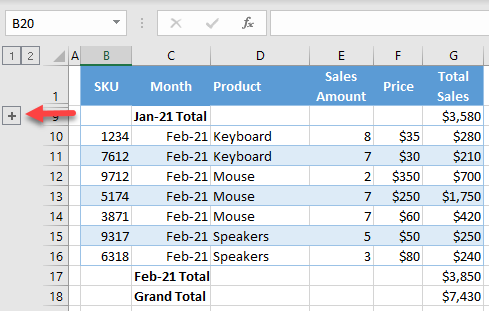
5. As in Step 4, we can expand the group (displaying rows) again, by clicking the plus sign. Following the exact same steps, we can also group data for Feb-21.
Group and Ungroup Multiple Levels of Data
Say we want to add another level of data grouping: Product. First, add a subtotal for all products.
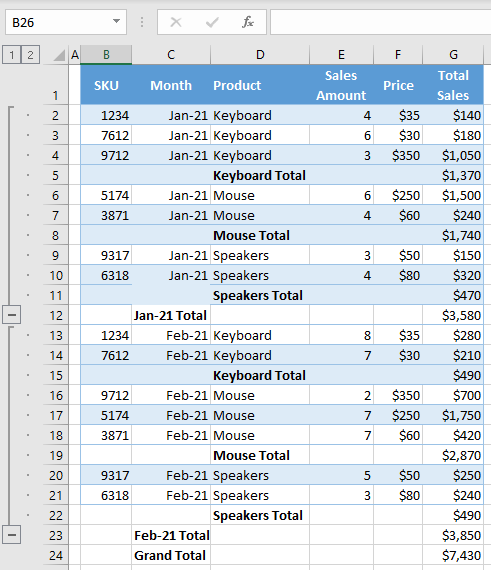
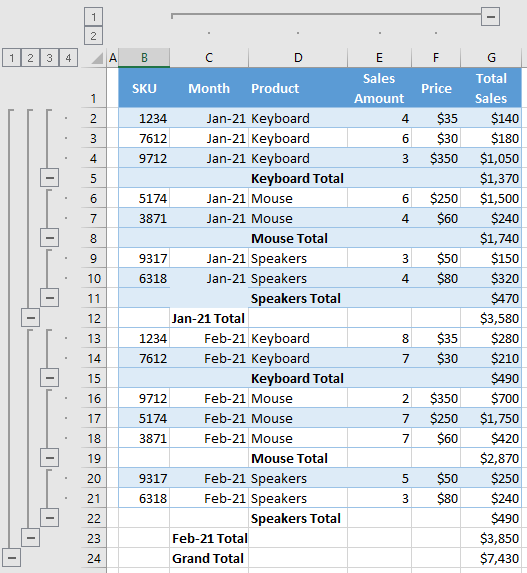
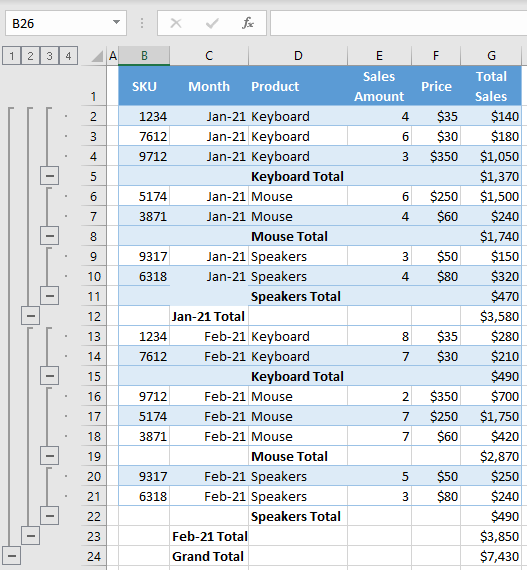
Currently, we have two groups for Month level and subtotals for months and products. Now, we want to add groups for products. We can do this in the exact same way as we did for months. In this case, we’ll add six groups of data, selecting – separately – Keyboard (D2:D4), Mouse (D6:D7), etc. As a result, our data and outline bars look like the picture below.
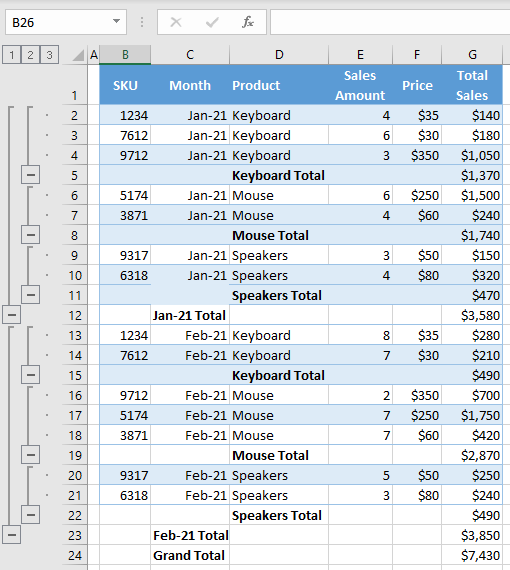
We now have two outline bars and the second one represents groups of products. Therefore, we can collapse all product groups, and have data organized in a way that displays only subtotals per month per product.
Group and Ungroup Rows Using Auto Outline
Instead of creating groups manually, we can also let Excel auto outline our data. This means that, if we have well-structured data, Excel will recognize groups and group data automatically.
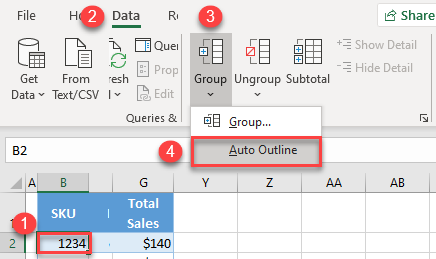
To let Excel outline the data automatically, (1) click anywhere in the data, then in the Ribbon, (2) go to the Data tab, click on the arrow below the Group icon, and (3) choose Auto Outline.
We get almost the same outline bars as in the manual example because Excel can recognize data groups. The only difference is that the Auto Outline option creates one group more for Grand Total, which can collapse all the data except the Total.
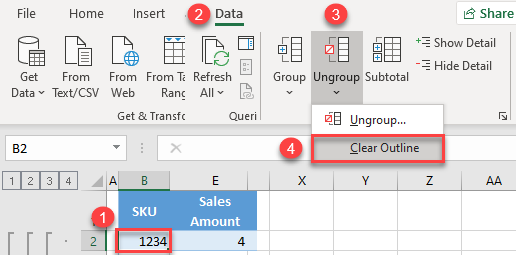
To remove outline bars created by Auto Outline, (1) click anywhere in the data then in the Ribbon, (2) go to the Data tab, click on the arrow below the Ungroup icon, and choose (3) Clear Outline.
This will remove all outline bars and ungroup all data.
Expand and Collapse Entire Outline
Say we want to collapse the entire outline (for example, Month). In the outline bar, at the top, click on the outline bar number we want to collapse (in our case, outline level 2).
As a result, all rows with Jan-21 and Feb-21 are collapsed and only the totals are displayed.
If we want to expand the entire outline again, (1) click on Grand Total, then in the Ribbon, (2) go to the Data tab, and in the Outline section, (3) click on Show Detail.
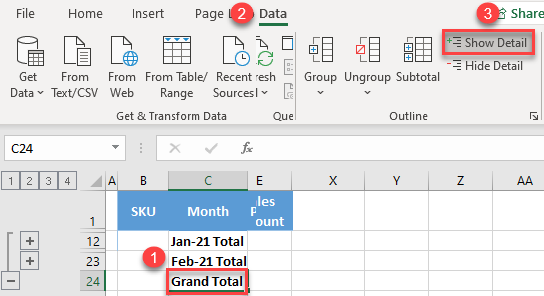
Now all data is visible again, and the Month outline is expanded.
Group and Ungroup Columns Manually
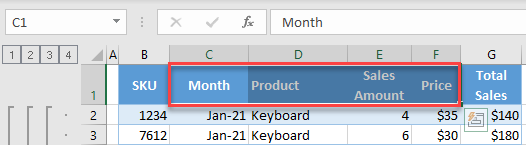
Similarly, we can also group columns in Excel. Say we want to display only SKU and the corresponding Total Sales.
1. Select all column headings that we want to group (in our case C1:F1).
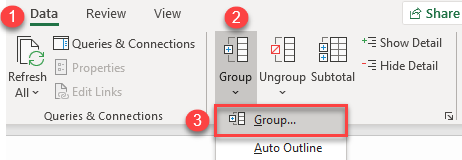
2. In the Ribbon, go to the Data tab, and in the Outline section, choose Group (or use the keyboard shortcut ALT + SHIFT + right arrow).
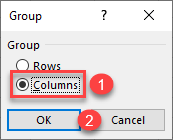
2. In the pop-up screen, (1) select Columns and (2) click OK.
As a result, we will get a new outline bar, but this time for the columns.
3. To collapse the group of columns, click on the minus sign at the end of the outline bar.
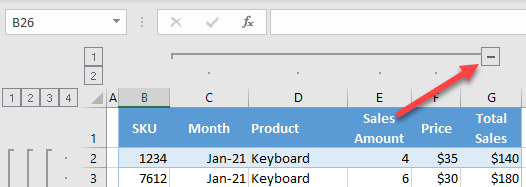
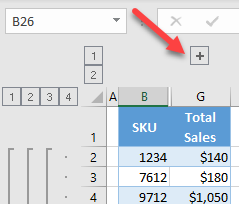
As a result, Columns C:F are collapsed.
Group and Ungroup Rows in Google Sheets
In Google Sheets, we can only group rows manually, so let’s use the same example and see how to group data into the same categories. To group by month:
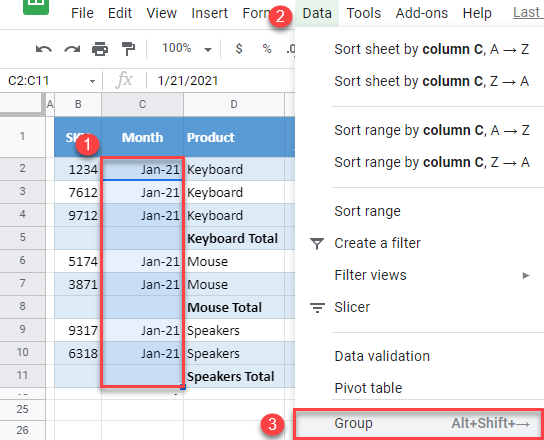
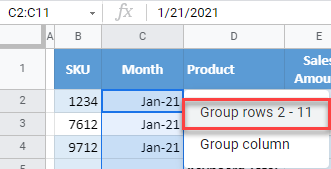
1. (1) Select all rows with Jan-21, then in the menu, (2) go to Data, and click on (3) Group.
2. In the new window beside the selection, click on Group rows 2 – 11.
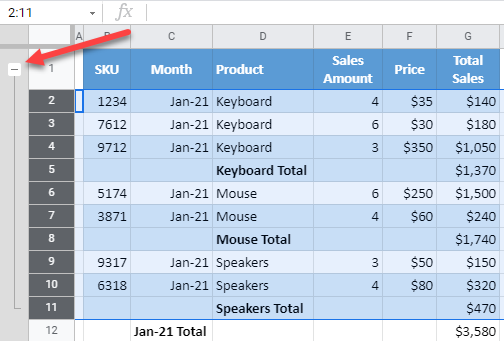
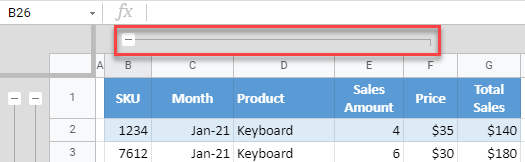
Jan-21 (Rows 2–11) are now grouped, and we can see the outline bar on the left side. The difference compared to Excel, is that the minus/plus sign for collapse/expand is a the top of each group.
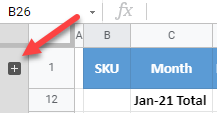
3. To collapse Jan-21, click the minus sign at the top of the outline bar for months.
Now, data for the month are collapsed, and we can see only the Jan-21 Total row.
4. We now get the plus sign, so we can expand the group again.
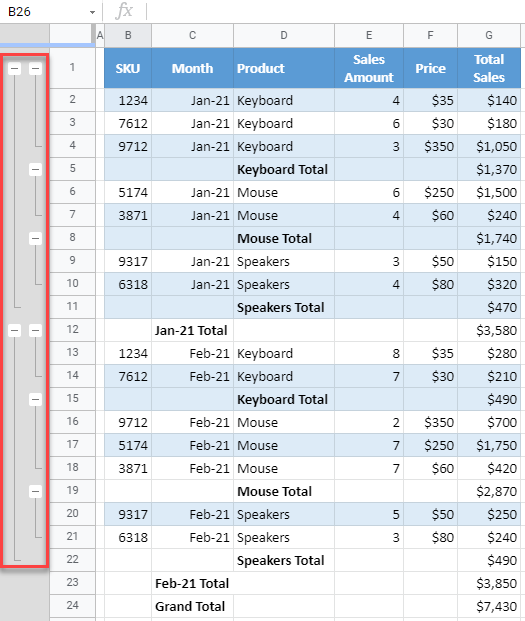
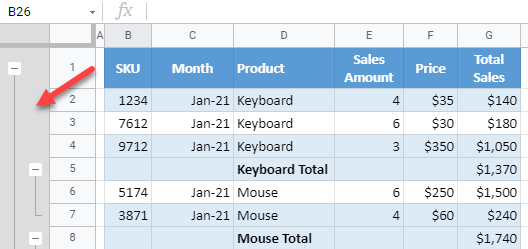
5. Following these steps, we can also group Feb-21 and create a new outline for the Product data level. When we’re done, the data and outline bars should look like this:
Ungrouping data in Google Sheets works just like grouping.
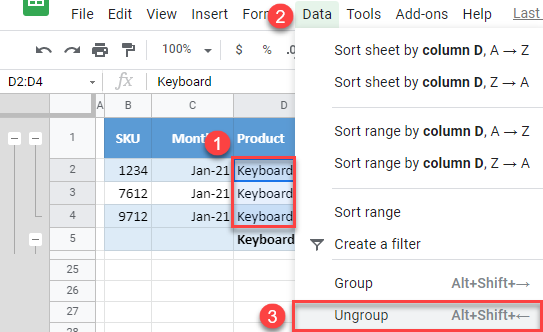
1. (1) Select the data we want to ungroup (Keyboard in Jan-21– cells D2:D4), then in the menu, (2) go to Data, and (3) click on Ungroup.
2. In the new window beside the selection, click on Ungroup rows 2 – 4.
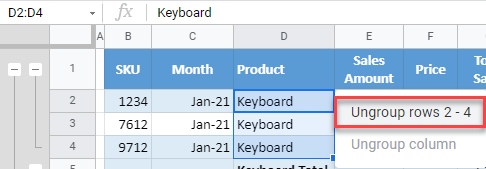
Those three rows are now ungrouped and removed from the outline bar.
Group and Ungroup Columns in Google Sheets
Grouping columns can be done in a similar way to grouping rows.
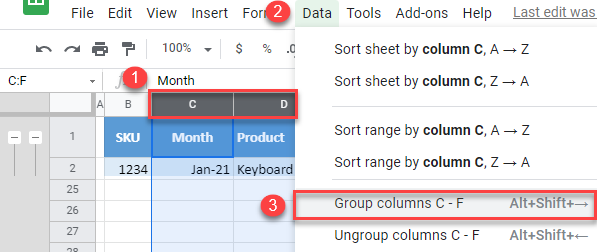
Select Columns C:F, then in the menu, go to Data, and click on Group columns C – F.
Now, we get the outline bar for column grouping.
To ungroup columns, select Columns C:F, go to Data, and click on Ungroup columns C – F.
