How to Convert an Excel Table to a Normal Range
Written by
Reviewed by
This tutorial demonstrates how to convert a table to a data range (and the other way around) in Excel.
You have the option in Excel to create a table to work with data. Excel tables have features not available in a normal range, but the table format isn’t always best for what you’re doing.
Convert a Table to a Data Range
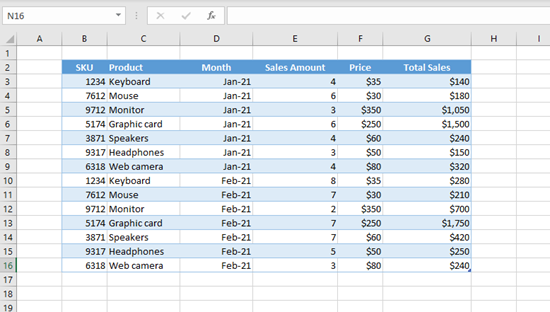
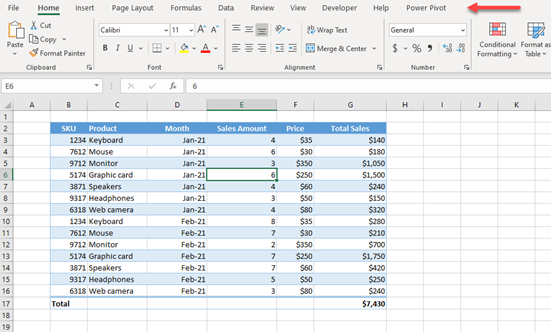
Say you have the following table with sales data and want to convert it to a normal range.
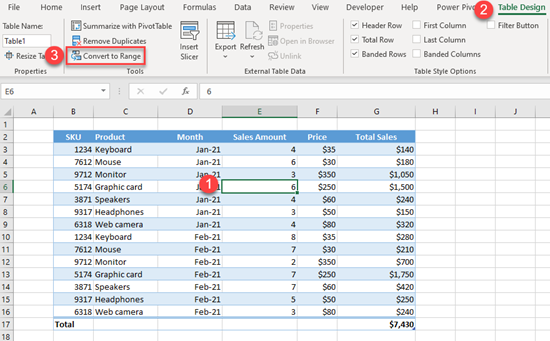
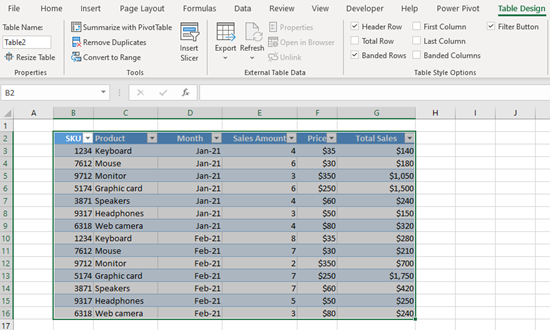
To convert this table to a data range, first click anywhere in the table. In the Ribbon, go to the Table Design tab, and click on Convert to Range.
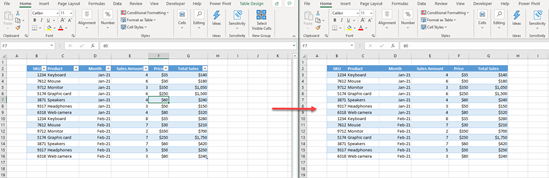
As a result, you have the same data, but it’s no longer set up as an Excel table. To check this, click anywhere in the dataset, and see that now the Table Design tab doesn’t appear in the Ribbon.
Convert a Data Range to a Table
Now let’s see how to convert the data range back to a table.
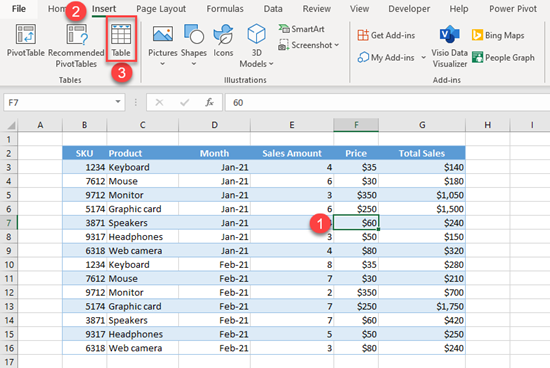
- First, click anywhere in the data range, then in the Ribbon, go to the Insert tab, and click on Table. The keyboard shortcut for this is CTRL + T.
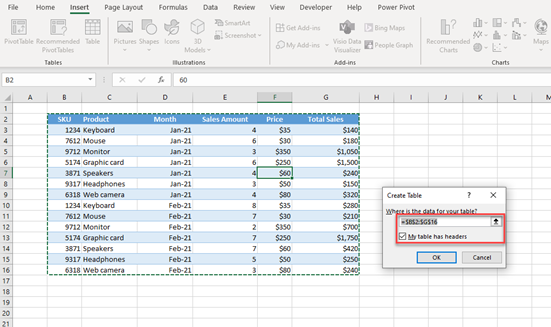
- In the pop-up screen, the whole data range is selected by default, and My table has headers is checked. Leave as is and click OK.
The data range is converted to a table, so when you select or click on the data, you get the Table Design tab on the Ribbon.
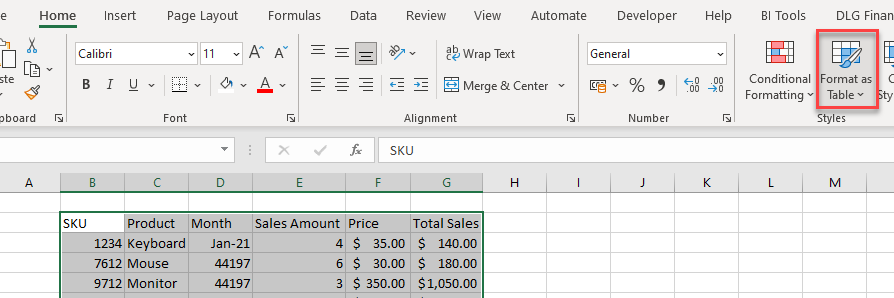
You can also use the Format as Table option to convert a normal data range into a table.