Wilcoxon Rank Sum Test (Mann Whitney U Test) – Excel and Google Sheets
Written by
Reviewed by
This tutorial will demonstrate how to use the Wilcoxon Rank Sum Test (Mann Whitney U Test) in Excel and Google Sheets.
The Wilcoxon Rank Sum test, also called the Mann Whitney U Test, is a non-parametric test that is used to compare the medians between two populations. In other words, it tests if two samples are likely to be from the same population. It performs a similar function as the two-sample independent t-test except that, unlike in the two-sample independent t-test, it does not require the normality of the population.
Compare Two-Sample Independent T-Test and Wilcoxon Rank Sum Test
- Both the Two-Sample Independent T-Test and Wilcoxon Rank Sum Test are used to determine whether there is a statistically significant difference between TWO sets of independent samples.
- The Two-Sample Independent T-Test assumes that the dataset is from a normally distributed population but the Wilcoxon Rank Sum test does not make this assumption.
When to Use Wilcoxon Signed-Rank Test
The Wilcoxon Rank Test is used when any of the sets of data violates the normality condition and the two sets of samples are independent.
Assumptions for the Wilcoxon Rank Sum Test
- The data being measured must be at the ordinal or continuous level. (i.e. the data must be a ranked scale or a number.)
- The observations from both samples are independent of each other.
How to Perform the Wilcoxon Rank Sum Test in Excel
Wilcoxon Rank Sum Test Table of Critical Values
In this method, we compare the Wilcoxon Rank Sum test statistic with the critical value. Listed below is the step-by-step guide on how to perform the Wilcoxon Rank Sum test using the method of critical values.
Example
Background: A new drug has been produced for the treatment of headaches and pains. The producer claims that the drug relieves headaches fastest than the current drugs in the market. A researcher wants to test this claim, so, he randomly placed patients with severe headaches in two groups. He administered the new drug to one of the groups, and one of the popular older drugs to the other group and records the time, in minutes, it took for each person to feel relief from the headache. The result is presented in the table below. Test at a 5% significant level whether there is a significant difference in the time it takes for the new drug and the old drug to relieve headache.
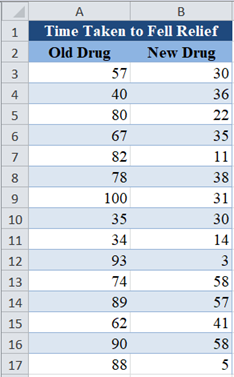
First, assign the rank to each data point (Time) from the smallest to the largest using the RANK.AVG Function:
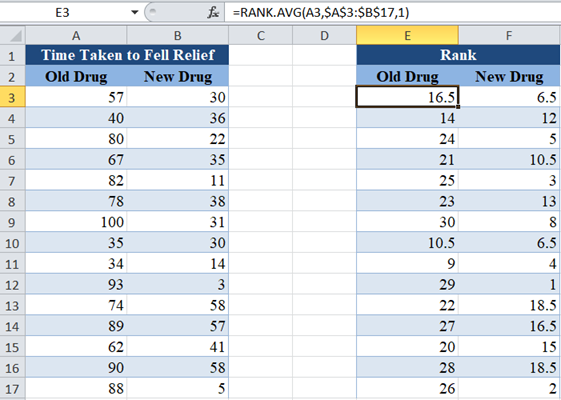
Note that we used absolute referencing for the range in the RANK.AVG Function so that we can easily paste the formula to other cells without changing the range.
Next, we obtain the sum of the ranks for each group (the old drug group and the new drug group).
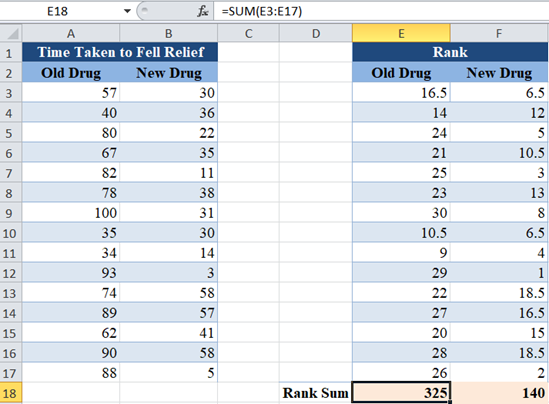
Next, use the COUNT Function to obtain the sample sizes of the two groups as shown below:
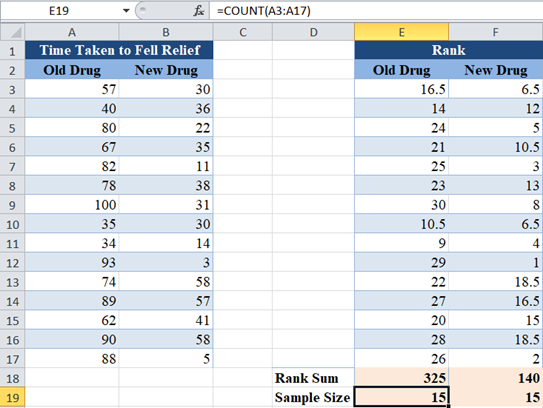
The test statistics for the Wilcoxon Rank Sum Test is denoted by U and is the smaller of U1 and U2 defined by:


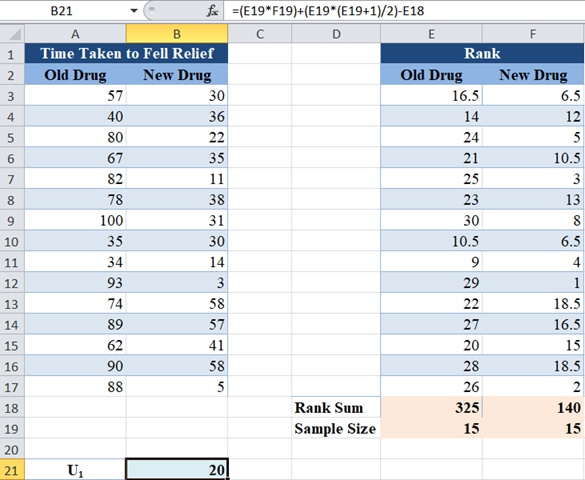
Where n1 and n2 are the sample sizes of group 1 (old drug group) and group 2 (new drug group) respectively, and R1 and R2 are the sums of the ranks of group 1 and group 2 respectively.
Next, we calculate U1 and U2 as follows:
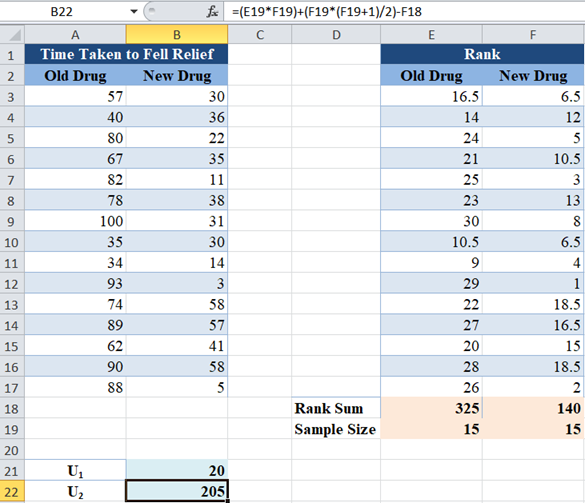
Similarly, for U2:
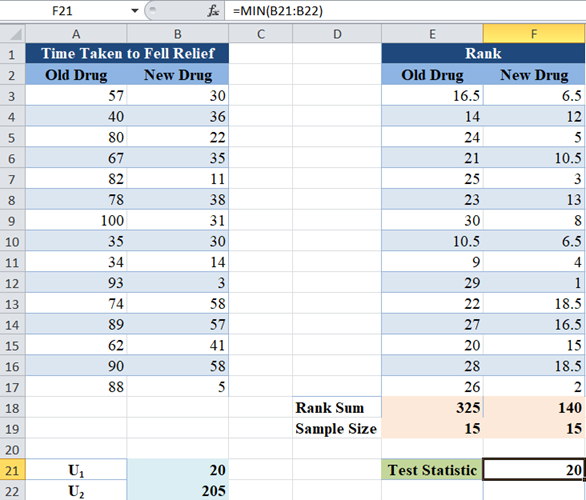
The test statistic , U, is the smaller of U1 and U2 and is calculated as follows:
Now, obtain the critical value for the sample size of n1= 15, n2 =15 and a significance level of 5% from the Wilcoxon Rank Sum table of critical values.
Note that we are doing a two-tailed test here because we are testing for the difference in values (and not increase or decrease in values) which is both ways, both increase and decrease in values.
An excerpt of the Wilcoxon Rank Sum (Mann-Whitney U) table of critical values for a two-tailed test is shown below:
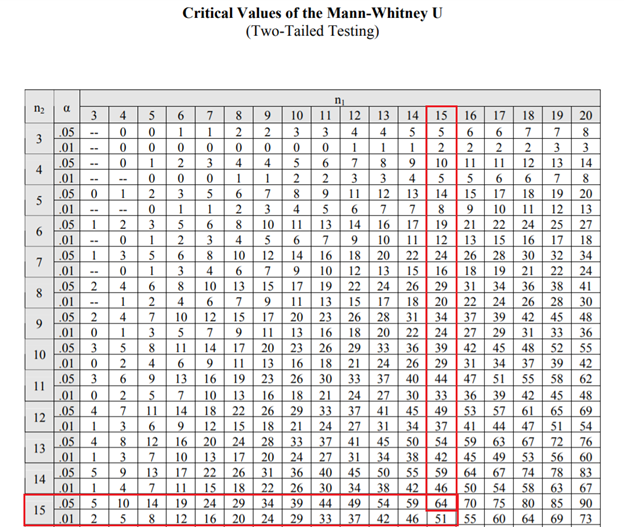
So, the critical value is 64.
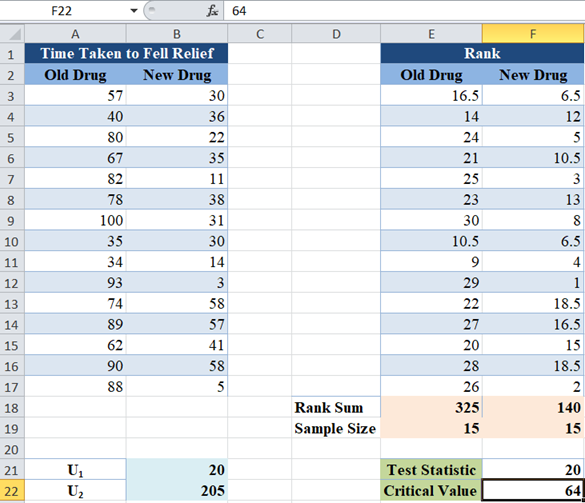
For the Wilcoxon Rank Sum test, we conclude that there is a significant difference between the groups when the Test Statistics is less than or equal to the Critical Value.
Here, the test statistic is 20 and the critical value is 64, since the test statistic is less than the critical value, we conclude that there is statistically significant evidence that the new drug relieves headaches faster than the old drug.
p-Value Method
Another method of performing the Wilcoxon Rank Sum test is by approximating the distribution to a normal distribution and then using the p-value of the approximated z-score to make a conclusion about the population of the groups.
In the following steps, we illustrate this method using the same example used in the previous method.
Example
Background: A new drug has been produced for the treatment of headaches and pains. The producer claims that the drug relieves headaches fastest than the current drugs in the market. A researcher wants to test this claim, so, he randomly placed patients with severe headaches in two groups. He administered the new drug to one of the groups, and one of the popular older drugs to the other group and records the time, in minutes, it took for each person to feel relief from the headache. The result is presented in the table below. Test at a 5% significant level whether there is a significant difference in the time it takes for the new drug and the old drug to relieve headache.
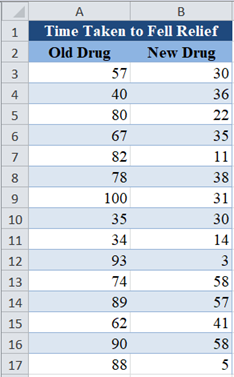
We are going to follow all the steps described in the previous method to obtain the sum of the ranks of the two groups and the sample sizes.
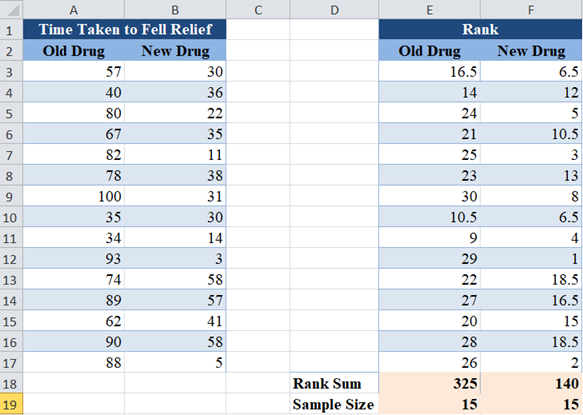
For this method, the test statistic, T, is the smaller of the sum of the ranks of the two groups, which is obtained as follows:
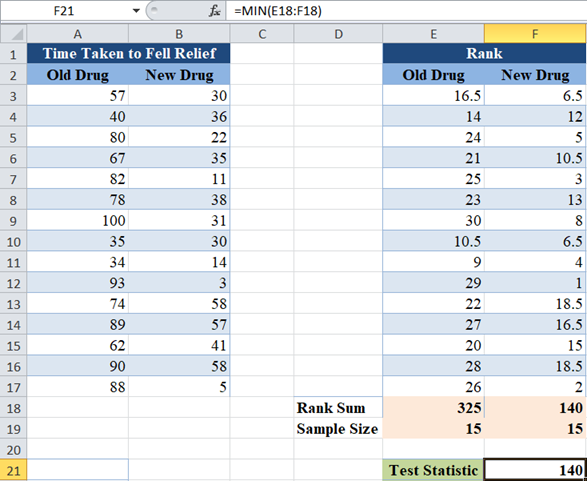
Now, we will obtain the mean and the standard error of the distribution. The mean (μ) of the distribution is given by:

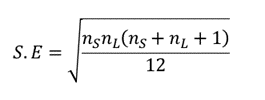
where ns and nL are the sample sizes of the smaller rank-sum and the larger rank-sum groups respectively, and the standard error is given by:

which is equivalent to:
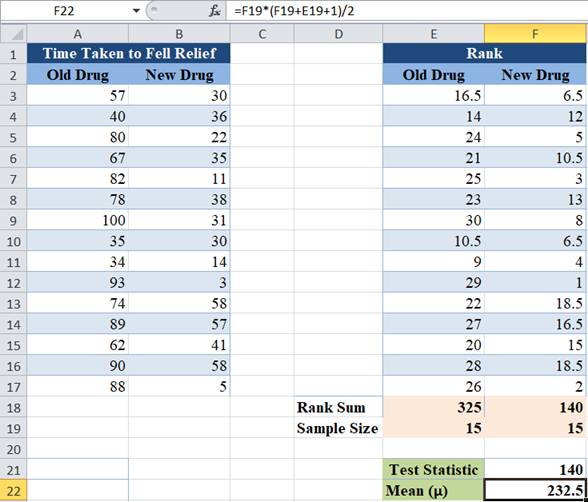
For our case, ns = nL= 15. So, we calculate the mean as follows:
and the standard error as follows:
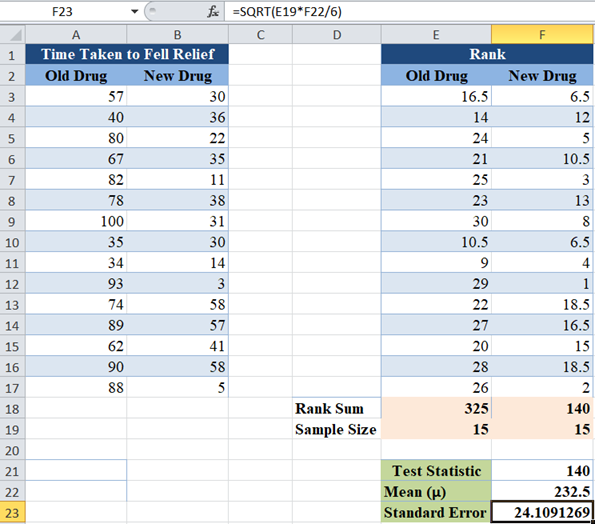
Next, calculate the z-score for the observations using the formula:

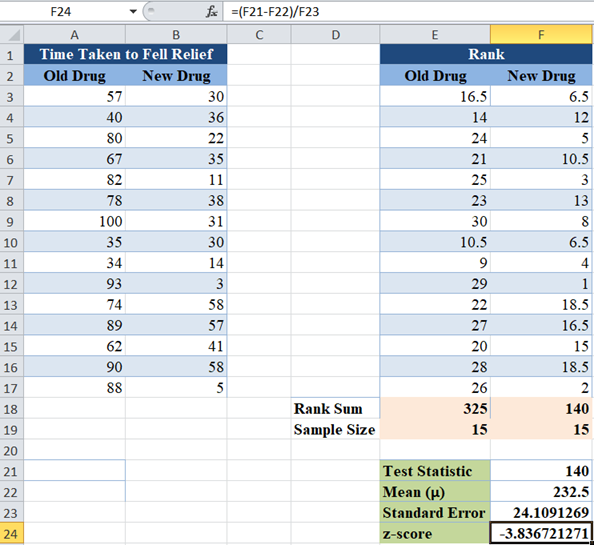
Finally, calculate the p-value for the observations using the NORM.DIST Function or NORM.S.DIST Function. Since we are performing a two-tailed test, we multiply the result of the NORM.DIST or NORM.S.DIST Functions by 2.
The NORM.DIST Function has the syntax: NORM.DIST(x, mean, standard_dev, cumulative), where is the test statistic, mean is as calculated from the data, standard_dev is the standard error, and select ‘TRUE’ for the cumulative distribution function.
The NORM.S.DIST Function has the syntax: NORM.S.DIST(z, cumulative), where is the z-score, and select ‘TRUE’ for the cumulative distribution function.
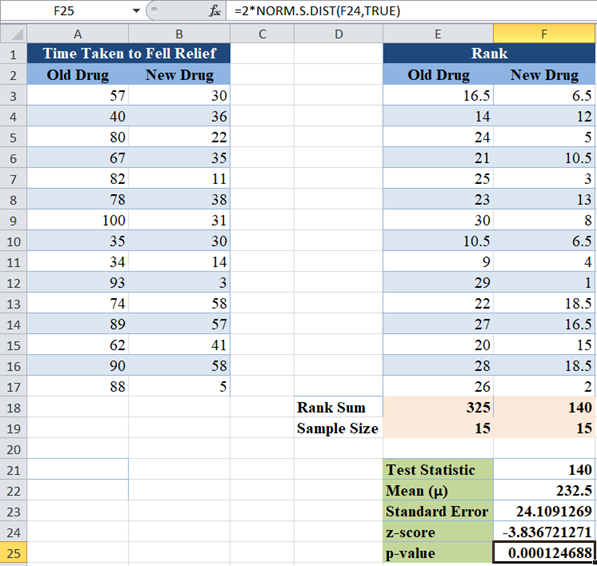
The p-value here is which is less than our significant level of 5% or 0.05. Therefore, ‘reject the null hypothesis’ which means that we conclude that there is statistically significant evidence that the new drug relieves headache faster than the old drug.
The Wilcoxon Signed-Rank Test in Google Sheets
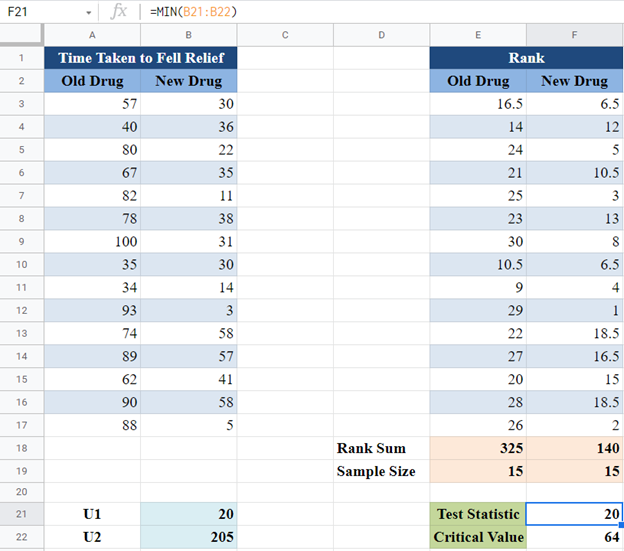
The Wilcoxon Signed-Rank test can be calculated in similar ways in Google Sheets as in Excel as shown below.
For the critical value method, we have:
