How to Create an Outline in Excel & Google Sheets
Written by
Reviewed by
Shortcut to Group Rows or Columns
This tutorial demonstrates how to create an outline in Excel and Google Sheets.
Create an Outline
Outlines in Excel let you group related rows. To create an outline, your data must be organized in your worksheet in a way that works with the grouping functionality.
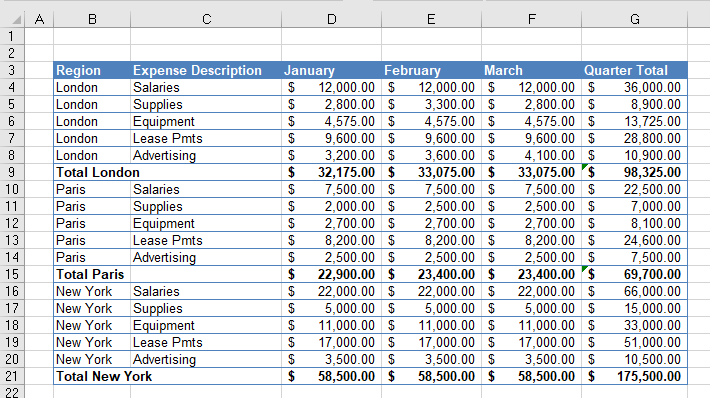
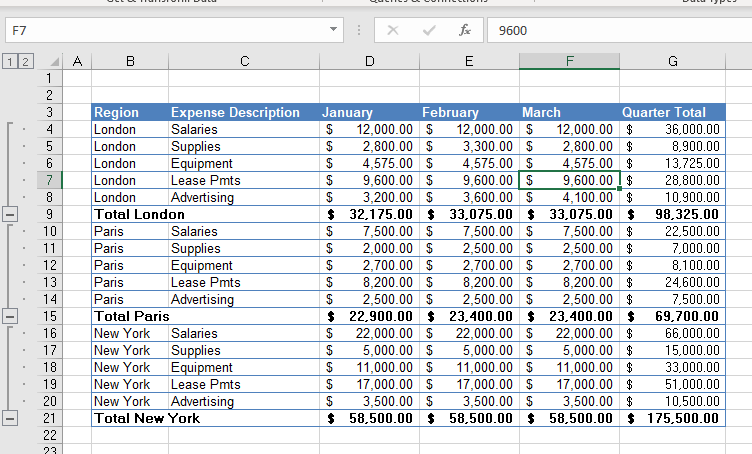
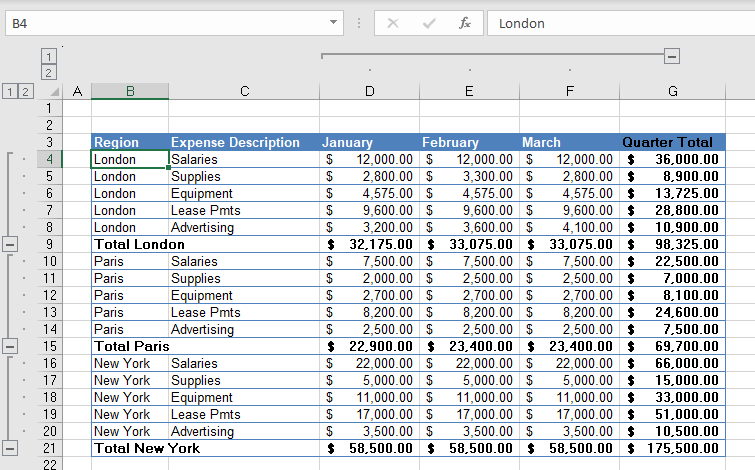
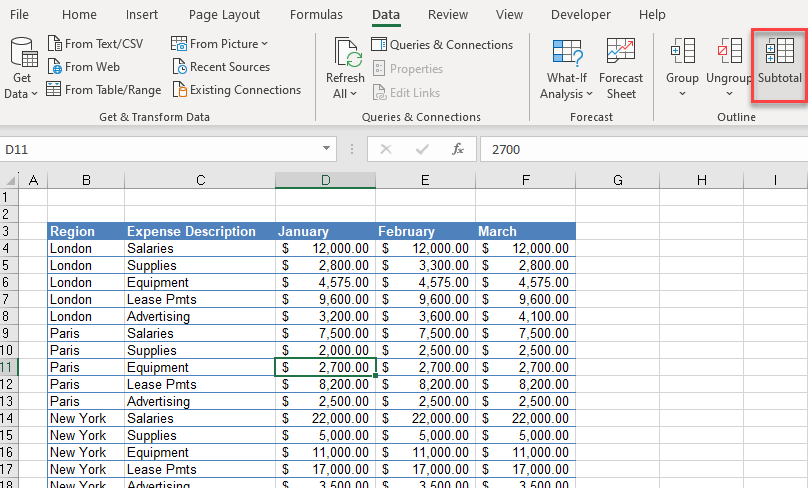
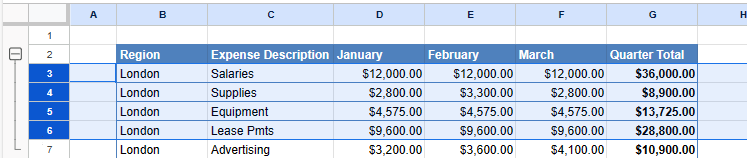
- Consider the following data. Each region has a total line (e.g., Row 9), and Column G totals the three months.
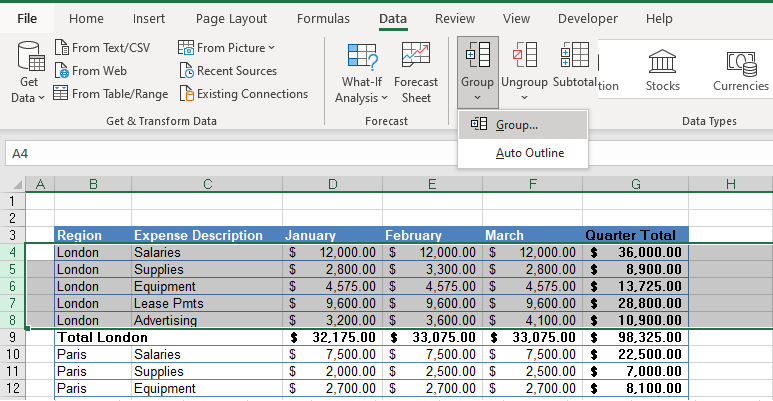
- For this example, group all rows within the London region, excluding the Total London row (i.e., 4:8). Select the rows, and then in the Ribbon, go to Data > Outline > Group > Group…
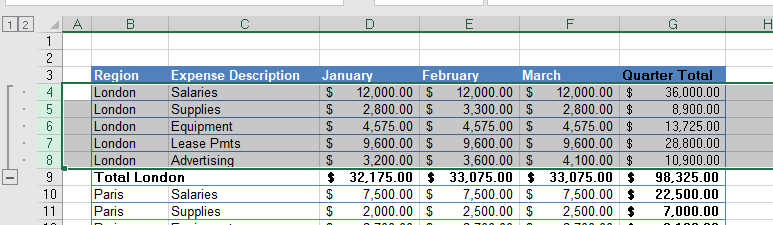
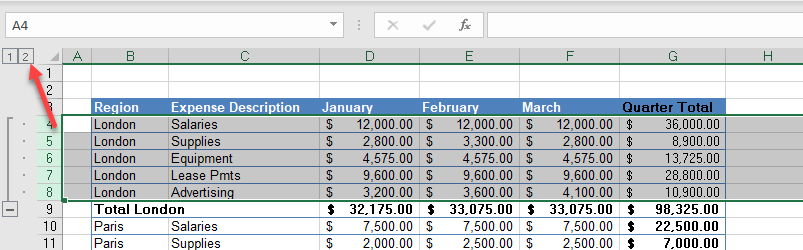
- Excel groups the rows together. A minus sign is added to the new outline bar on the left of the window, in the row directly underneath the grouped rows. The minus button lets you collapse and expand the group.
- Click on the minus sign to collapse the group. Collapsing the group changes the button to a plus sign and hides the individual rows within the group.
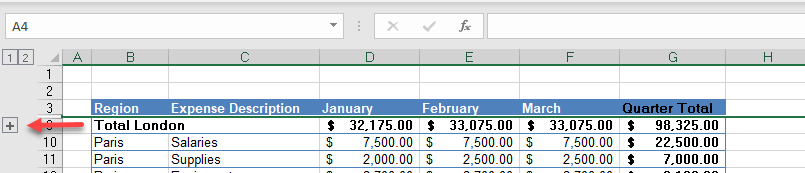
- To show the hidden rows again, click the plus sign (or click the 2 in the outline bar header).
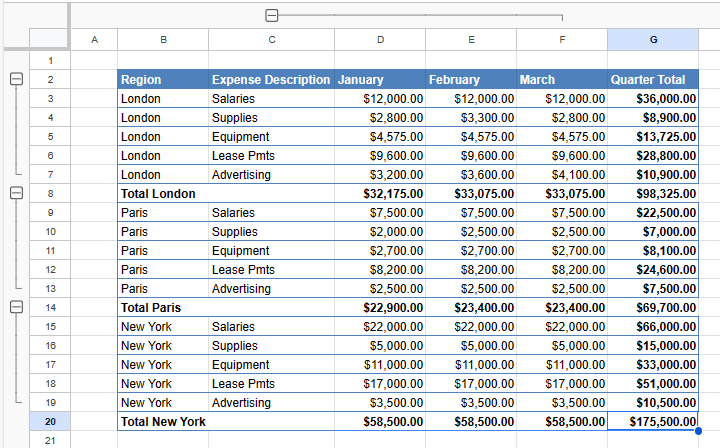
- Repeat Step 2 for each other region (here, Paris and New York) until you have completed your outline.
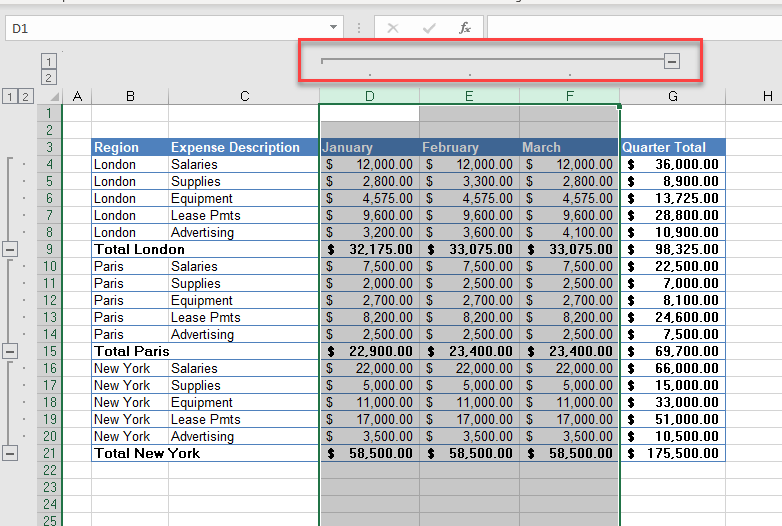
- Now, select the columns you want to group and create a column group. In the Ribbon, go to Data > Outline > Group > Group…
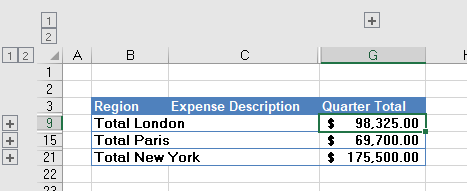
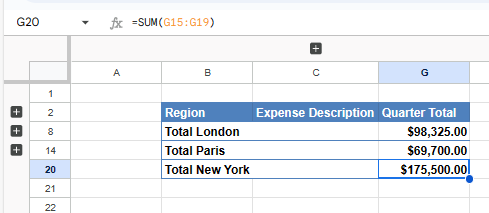
- Now you have group headers to both the rows and columns. Click the 1 on both the row and column headers to collapse the outline entirely.
- Click the 2 on both the row and column headers to fully expand the outline once again.
Clear an Outline
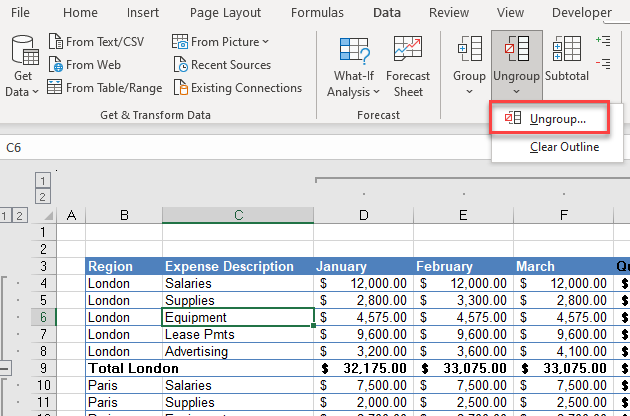
To remove a grouping, click within the group, and in the Ribbon, go to Data > Outline > Ungroup > Ungroup…
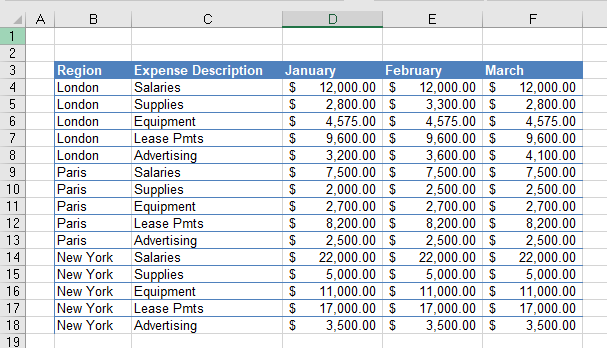
Remove the entire outline (all grouping) by going to Data > Outline > Ungroup > Clear Outline.

Auto Outline
If your data is set up like the example above, with organized sections and subtotals, you can skip the grouping process and instead apply an auto outline.
In the Ribbon, go to Data > Outline > Group > Auto Outline.
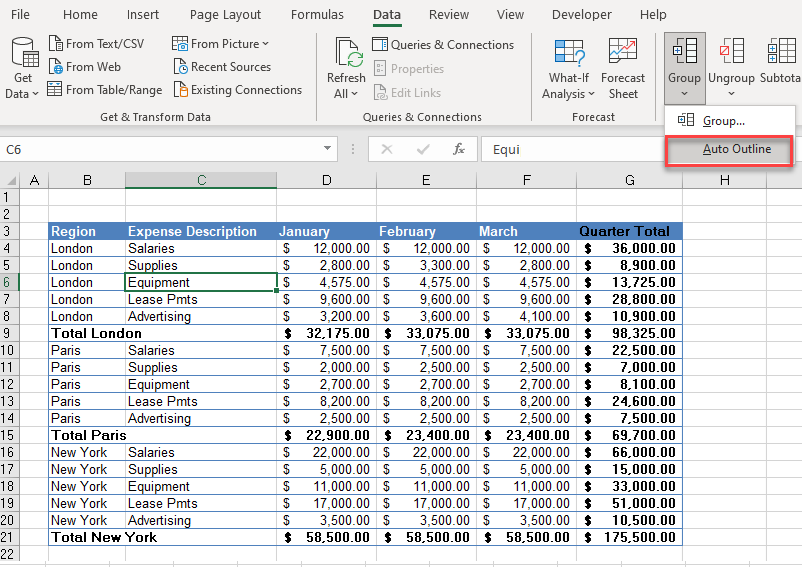
Auto Outline analyzes your data and automatically groups the rows and columns accordingly.
Subtotals
If your data is setup appropriately, but without subtotals, use the Subtotals command.
- In the Ribbon, go to Data > Outline > Subtotal.
- In the Subtotal dialog box, describe your data. You want to sum each month for each region.
- Tell Excel to add a subtotal At each change in Region.
- Choose Sum under Use function.
- Tick the January, February, and March columns under Add subtotal to. (Region and Expense Description aren’t numeric, so don’t use them.)
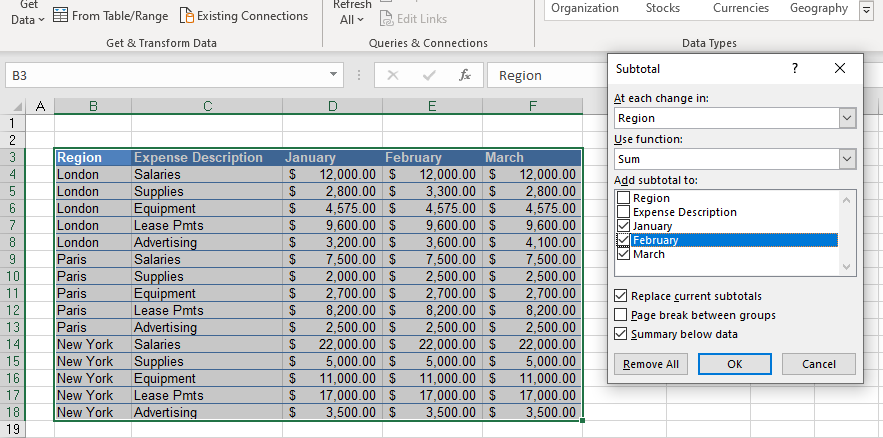
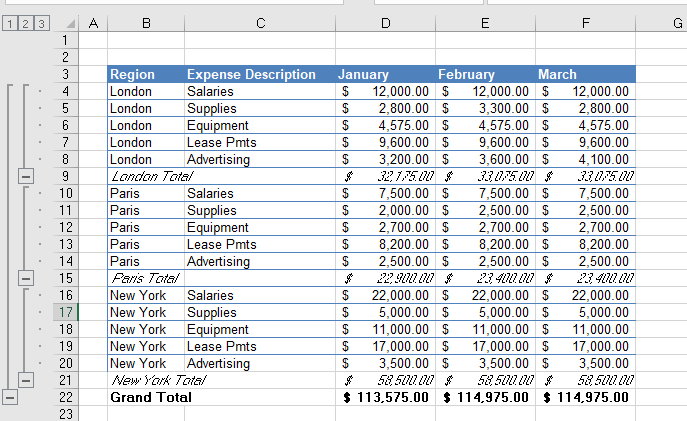
- Click OK. This totals each column by region and groups the subtotaled rows together, creating an auto outline.
Outlines in Google Sheets
Creating an outline in Google Sheets is similar.
- Select the rows to group, and then in the Menu, go to View > Group > Group rows x – y where x and y are the first and last rows selected.
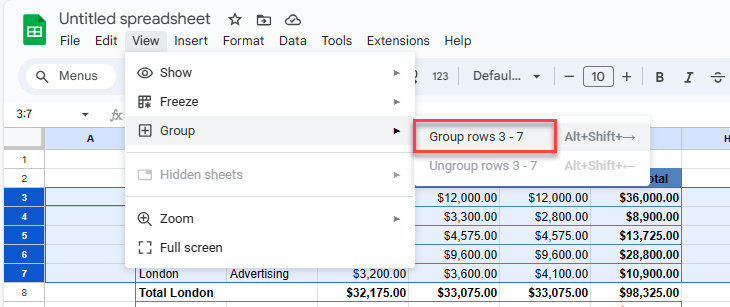
The main difference between Excel and Google Sheets outlines is that the grouping +/– signs are above the grouped rows in Google Sheets. (Excel adds the buttons below the rows.)
- Repeat Step 1 for each group.
Now you can click the minus signs to collapse groups.
Or click the plus signs to expand them.
