How to Group Cells (Rows / Columns) in Excel & Google Sheets
Written by
Reviewed by
Shortcut to Group Rows or Columns
This tutorial demonstrates how to group rows and columns in Excel and Google Sheets.
Grouping or outlining data in Excel allows you to show and hide rows or columns depending on how much detail you want to see onscreen. Excel allows up to eight levels of grouping. To use the group function in Excel, your data must be organized in your worksheet in a way that works with the grouping functionality.
Manually Group or Ungroup Rows
- To group several rows together, first highlight the rows you want to group.
- In the Ribbon, go to Data > Outline > Group > Group.
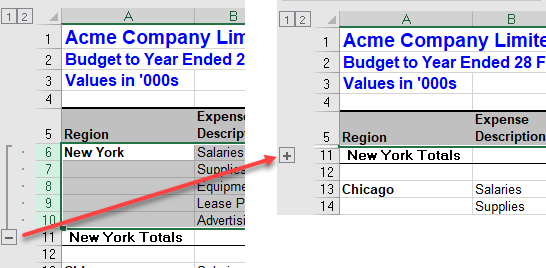
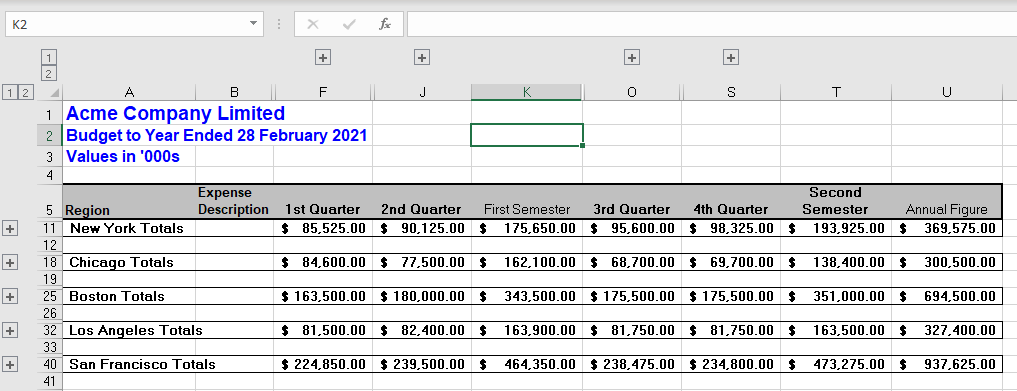
- A minus sign gets added into the outline bar on the left of the screen. Clicking on the minus collapses the group. The minus sign changes to a plus sign, indicating that there is hidden data.
- If necessary, repeat manual grouping to add more groups to the worksheet.
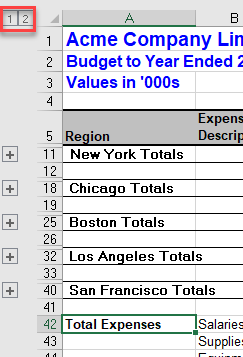
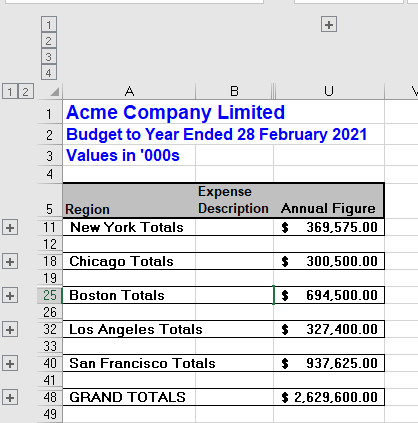
Tip: Instead of the +/– outline symbols, you can also use the 1 or 2 in the top-left corner of the screen to expand or collapse all the groups. Clicking on the 1 collapses all groups; clicking on 2 expands all groups.
Manually Group or Ungroup Columns
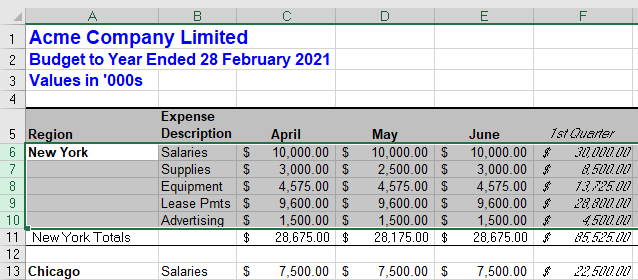
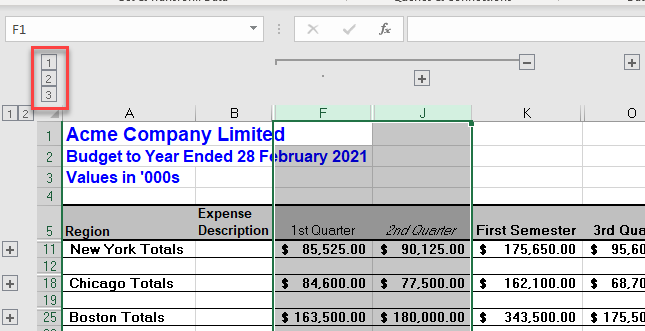
- To group several columns together, first highlight the columns you wish to group. This can be done whether or not there are existing row groups.
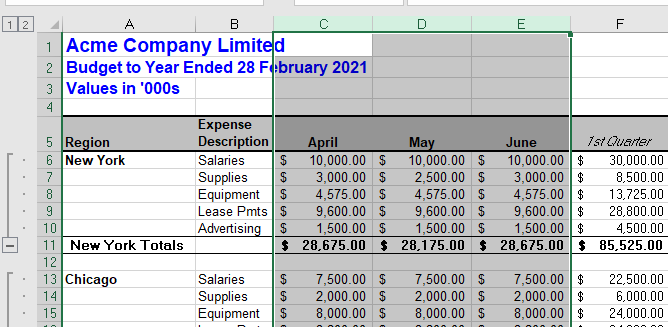
- In the Ribbon, go to Data > Outline > Group > Group to group the columns together. Repeat this until you have created all the groups you need.
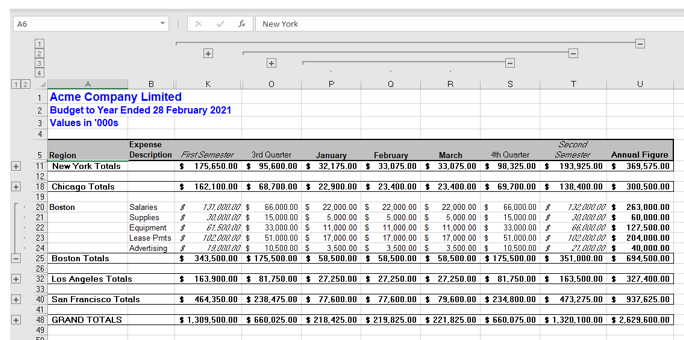
- Once you group columns (just like with rows), you can add a new level by grouping again. This adds a third level of grouping to the outline symbols in the top-left corner of the screen.
Once again, you can repeat this across the worksheet, adding up to eight levels of grouping.
Ungroup Rows or Columns
- Highlight the group you wish to ungroup and then, in the Ribbon, go to Data > Outline > Ungroup > Ungroup. This only removes one group.
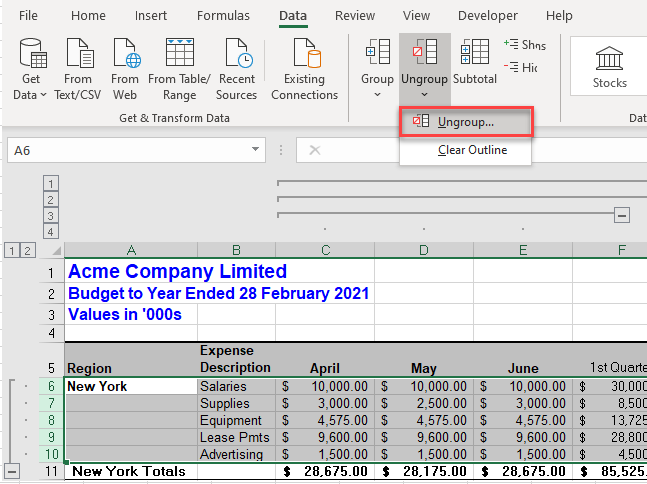
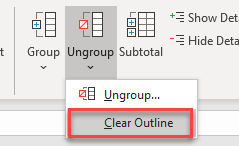
- To remove all the grouping in the worksheet, click anywhere in the data, and then in the Ribbon, go to Data > Outline > Ungroup > Clear Outline.
Auto Outline
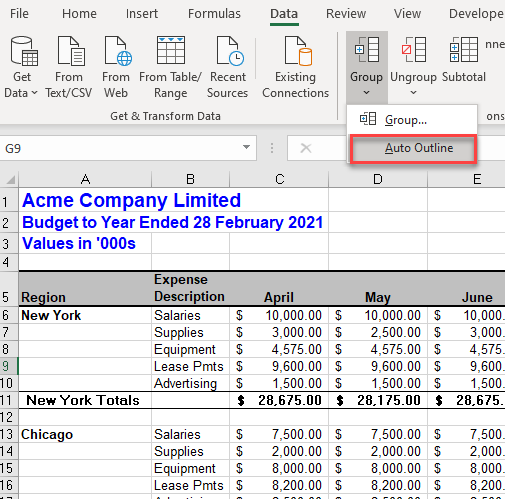
You can use the Auto Outline feature in Excel if your data is logically organized so that Excel recognizes the groups within the rows and columns. There must not be any blank rows in the data and the data must be summed or subtotaled at each level.
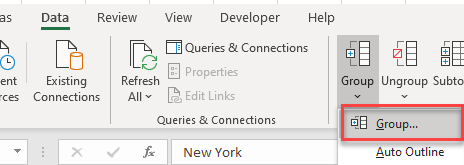
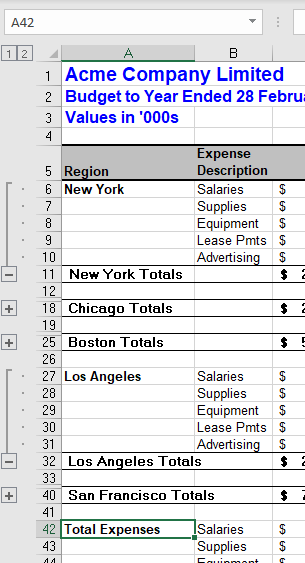
▸ Click anywhere in the data where you wish the outline to be created and then, in the Ribbon, go to Data > Outline > Group > Auto Outline.
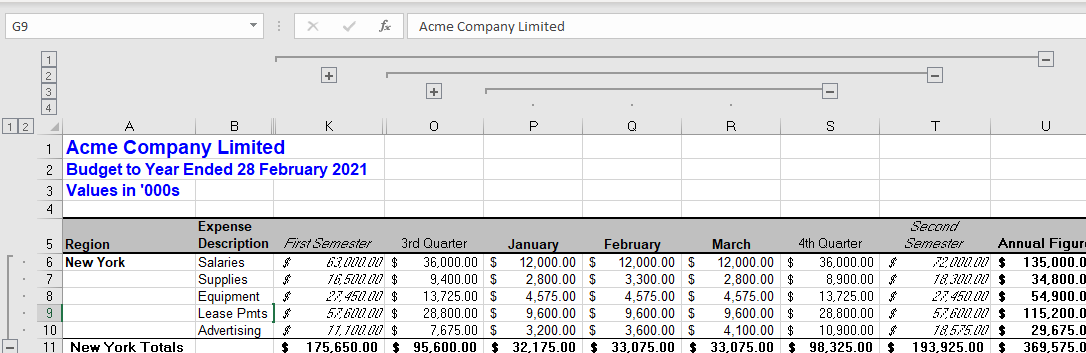
Excel creates as many grouping levels as the logical layout of the data has.
Group Cells in Google Sheets
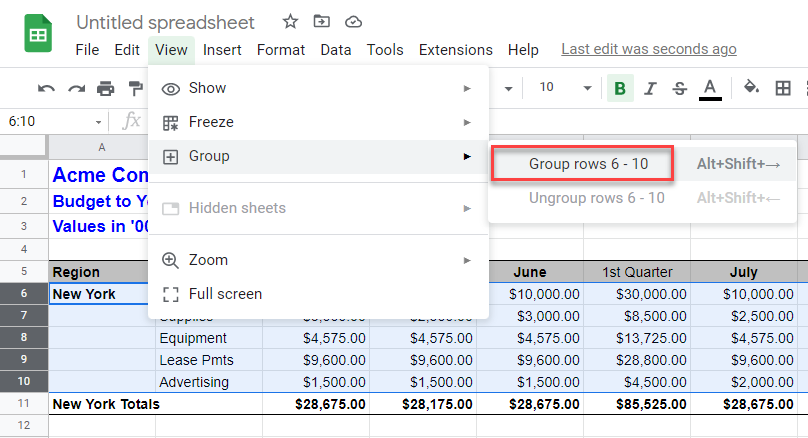
You can only group or ungroup rows and columns manually in Google Sheets.
- Select the rows you wish to group, and then in the Menu, go to View > Group > Group rows (the row numbers selected are shown).
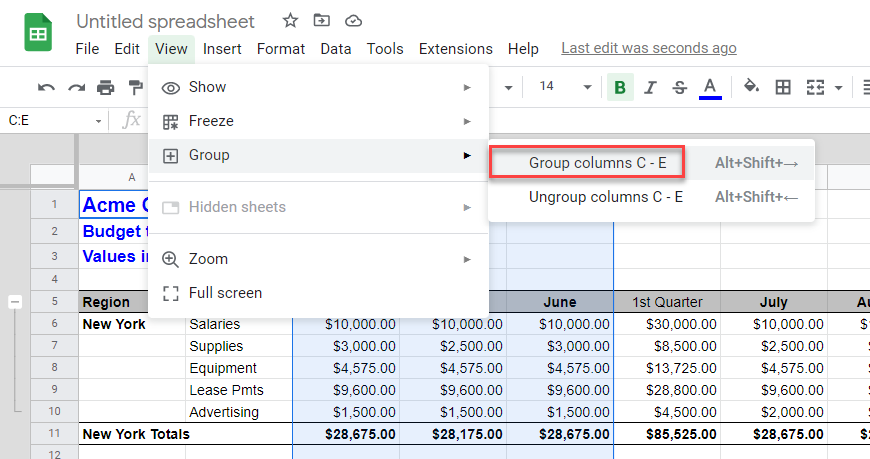
- Similarly, select the columns you wish to group and then in the Menu, go to View > Group > Group columns (the column letters selected are shown).
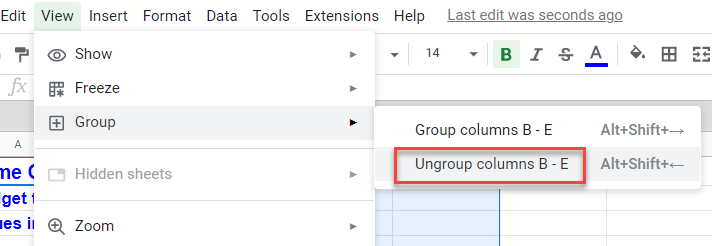
- To ungroup rows or columns, click in the group you wish to ungroup and then in the Menu, go to View > Group > Ungroup (rows or columns).